Magic Stat Simple. Fast. Nice. Magic.
✦  The ultimate statistical suite for macOS, Windows & Linux

From your spreadsheet to a publishable figure in seconds

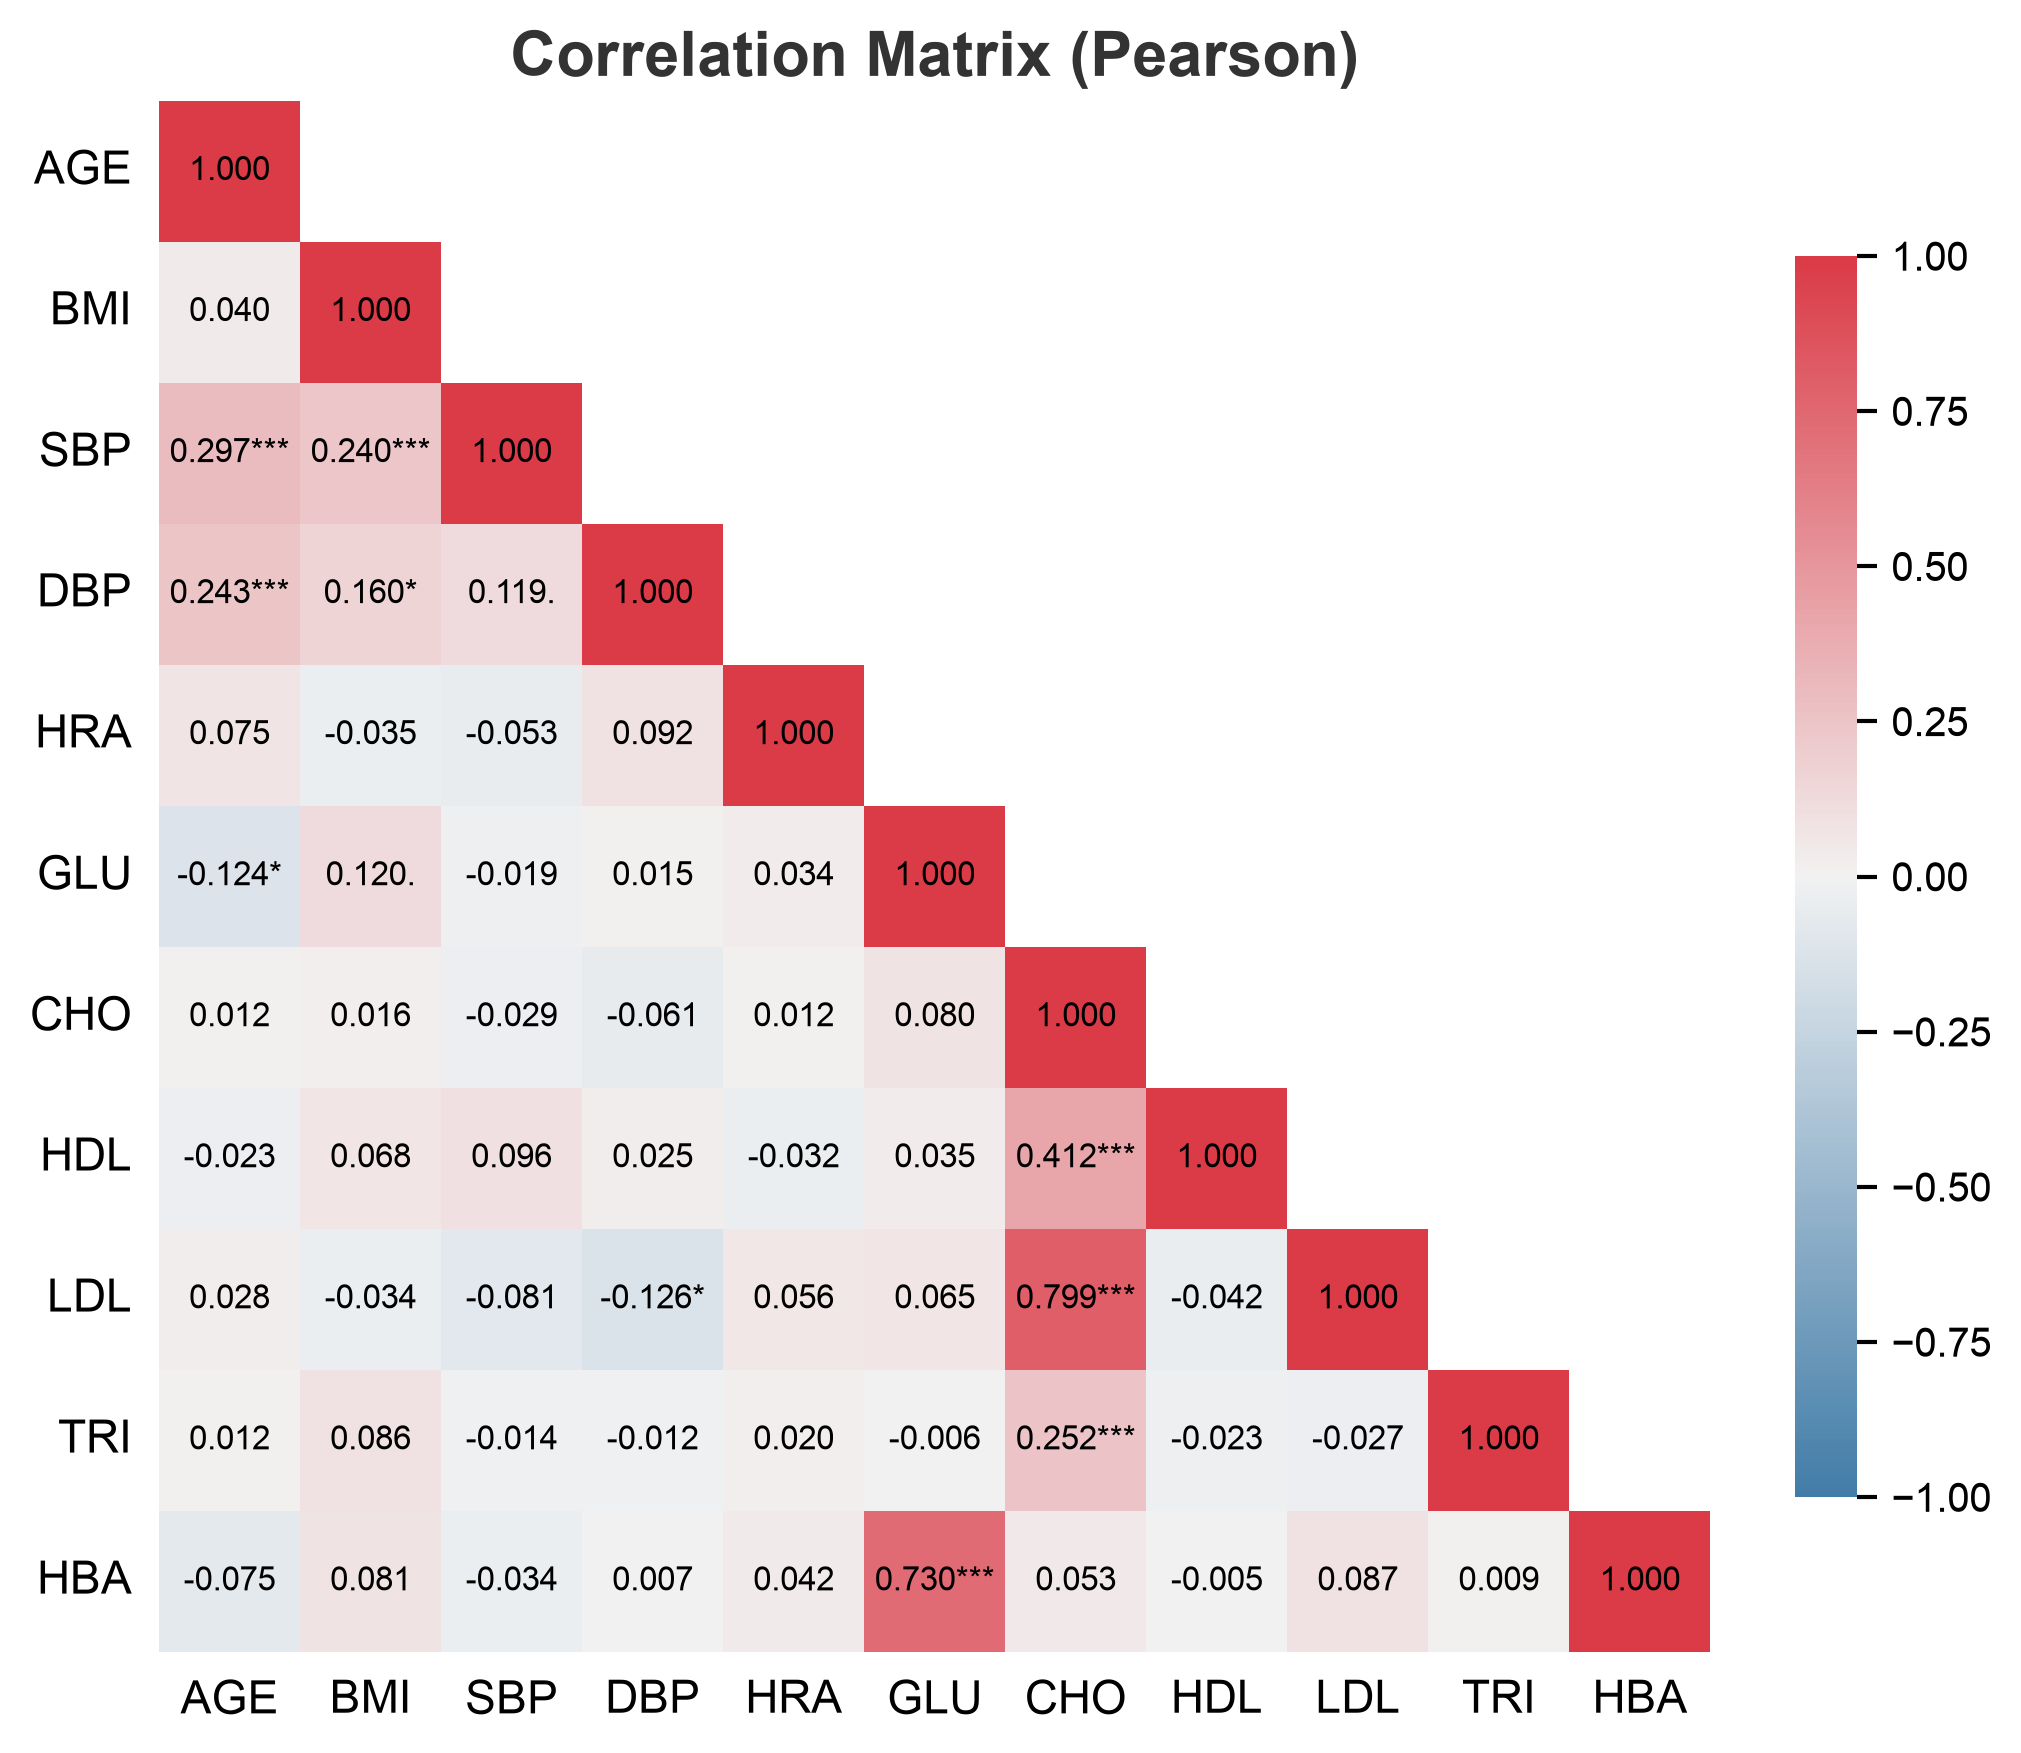
Magic Stat turns data into science. Go from exploratory analysis to structural equation modeling (SEM/PLS), with figures and tables already in scientific format — and a built-in AI that reads, interprets and comments every result.

✓ For macOS, Windows & Linux ✓ No command line ✓ Publication-quality output ✓ Built-in AI assistants
AI‑empowered

chat Magic Stat Assistant

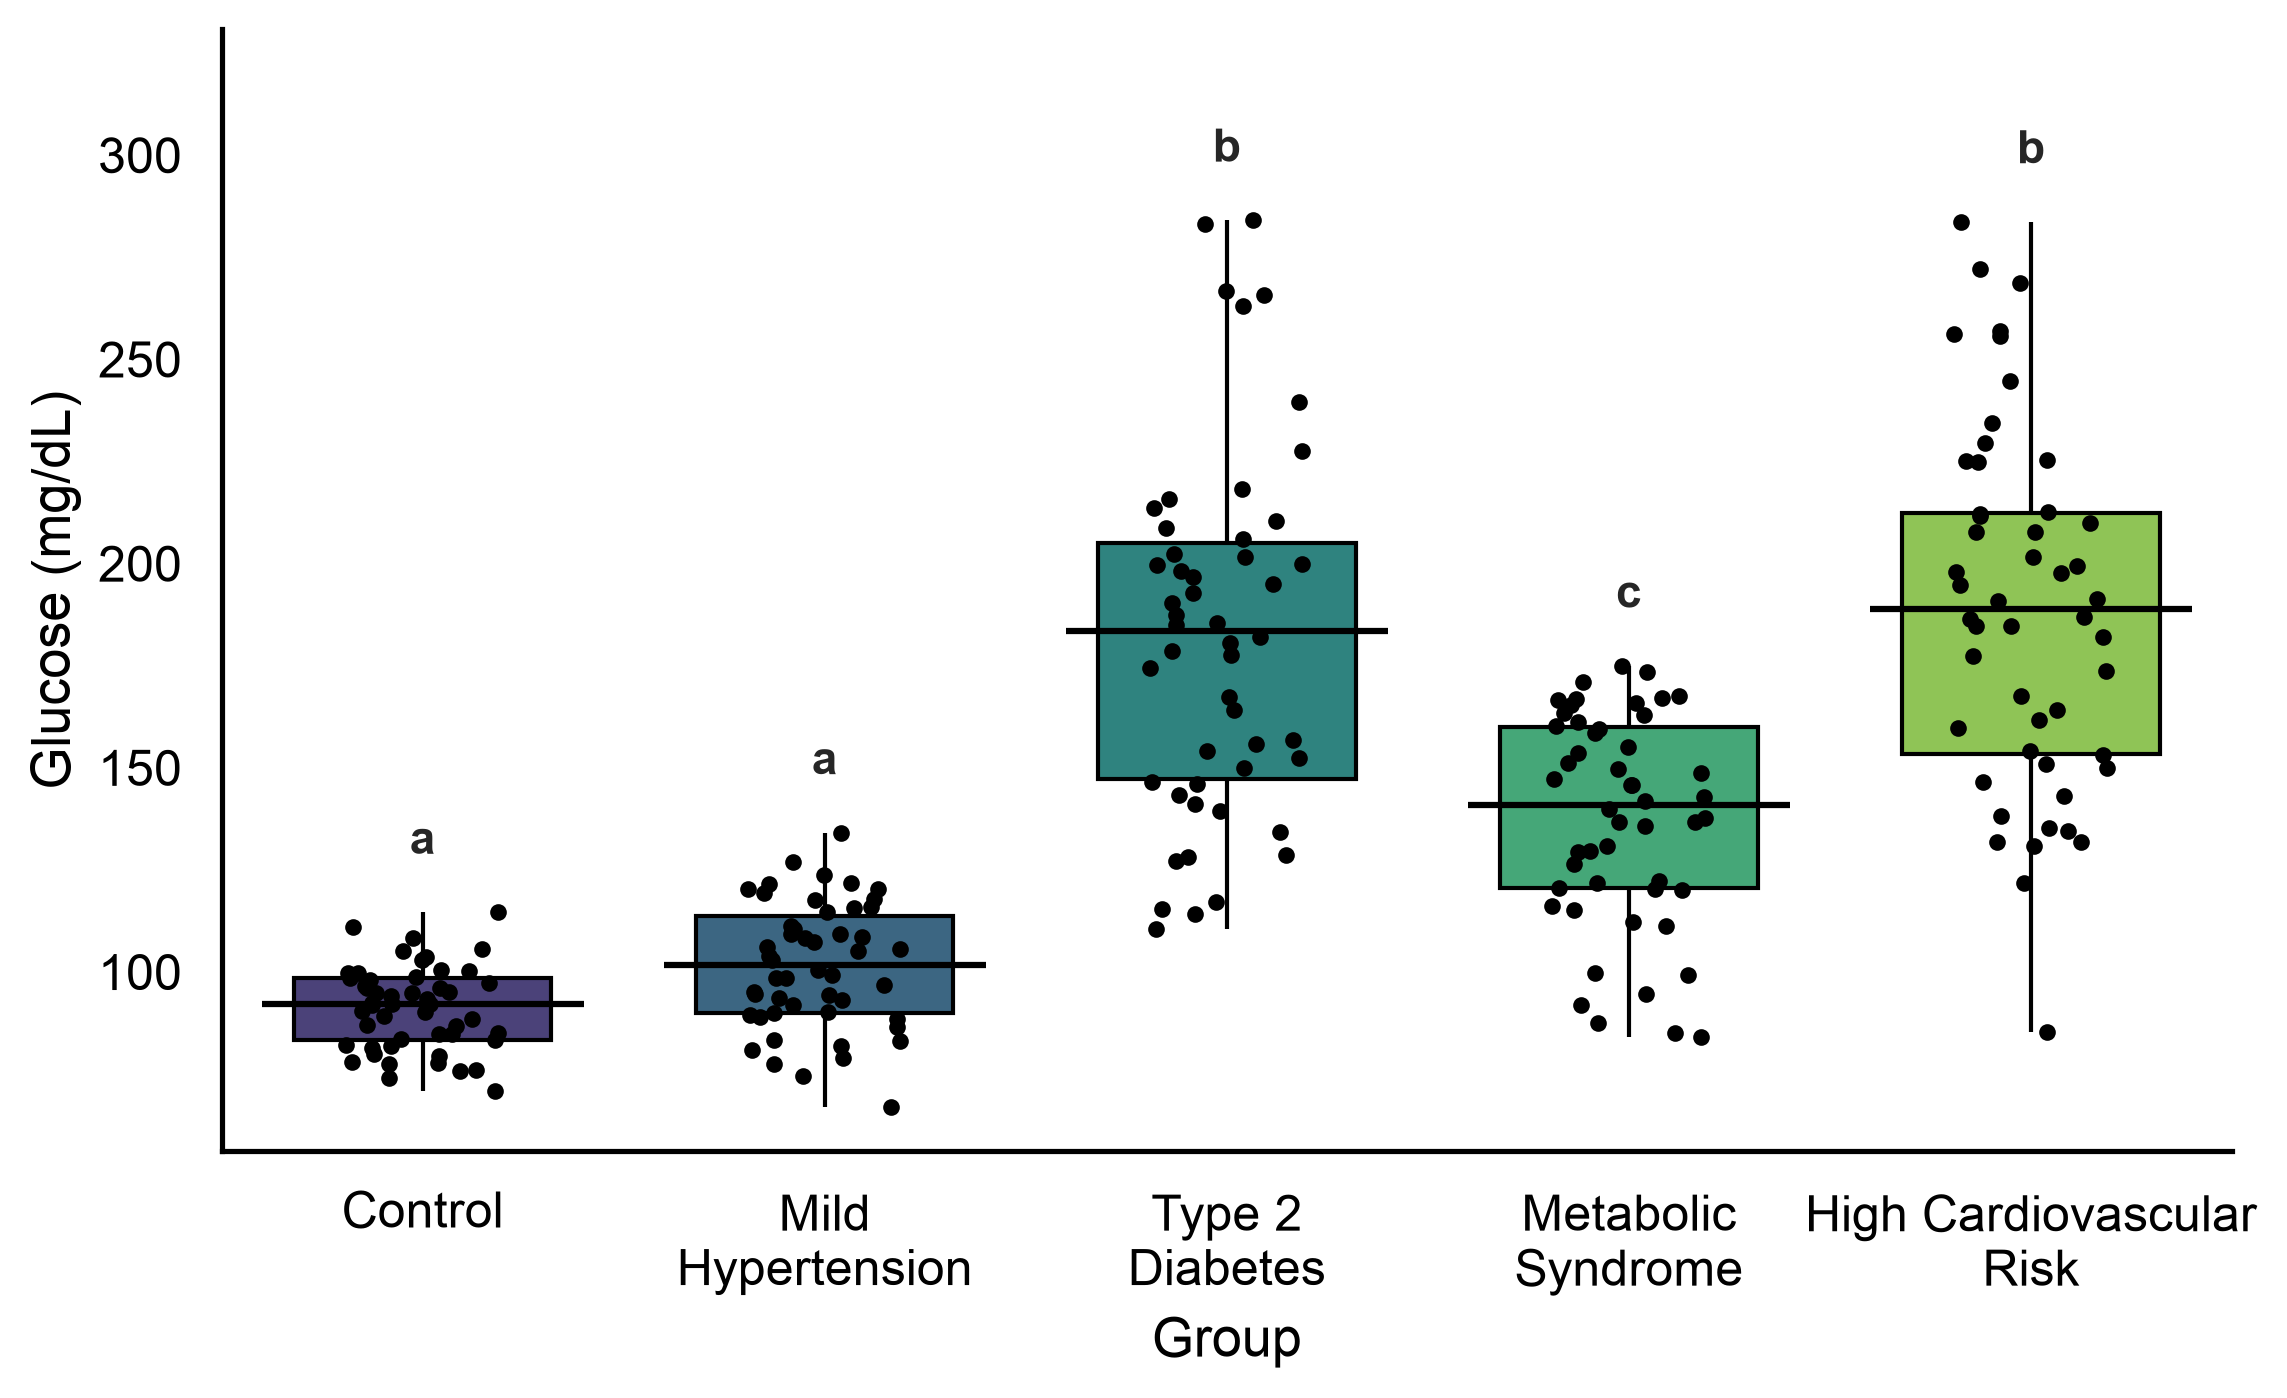
Box plot

chat Magic Stat Assistant

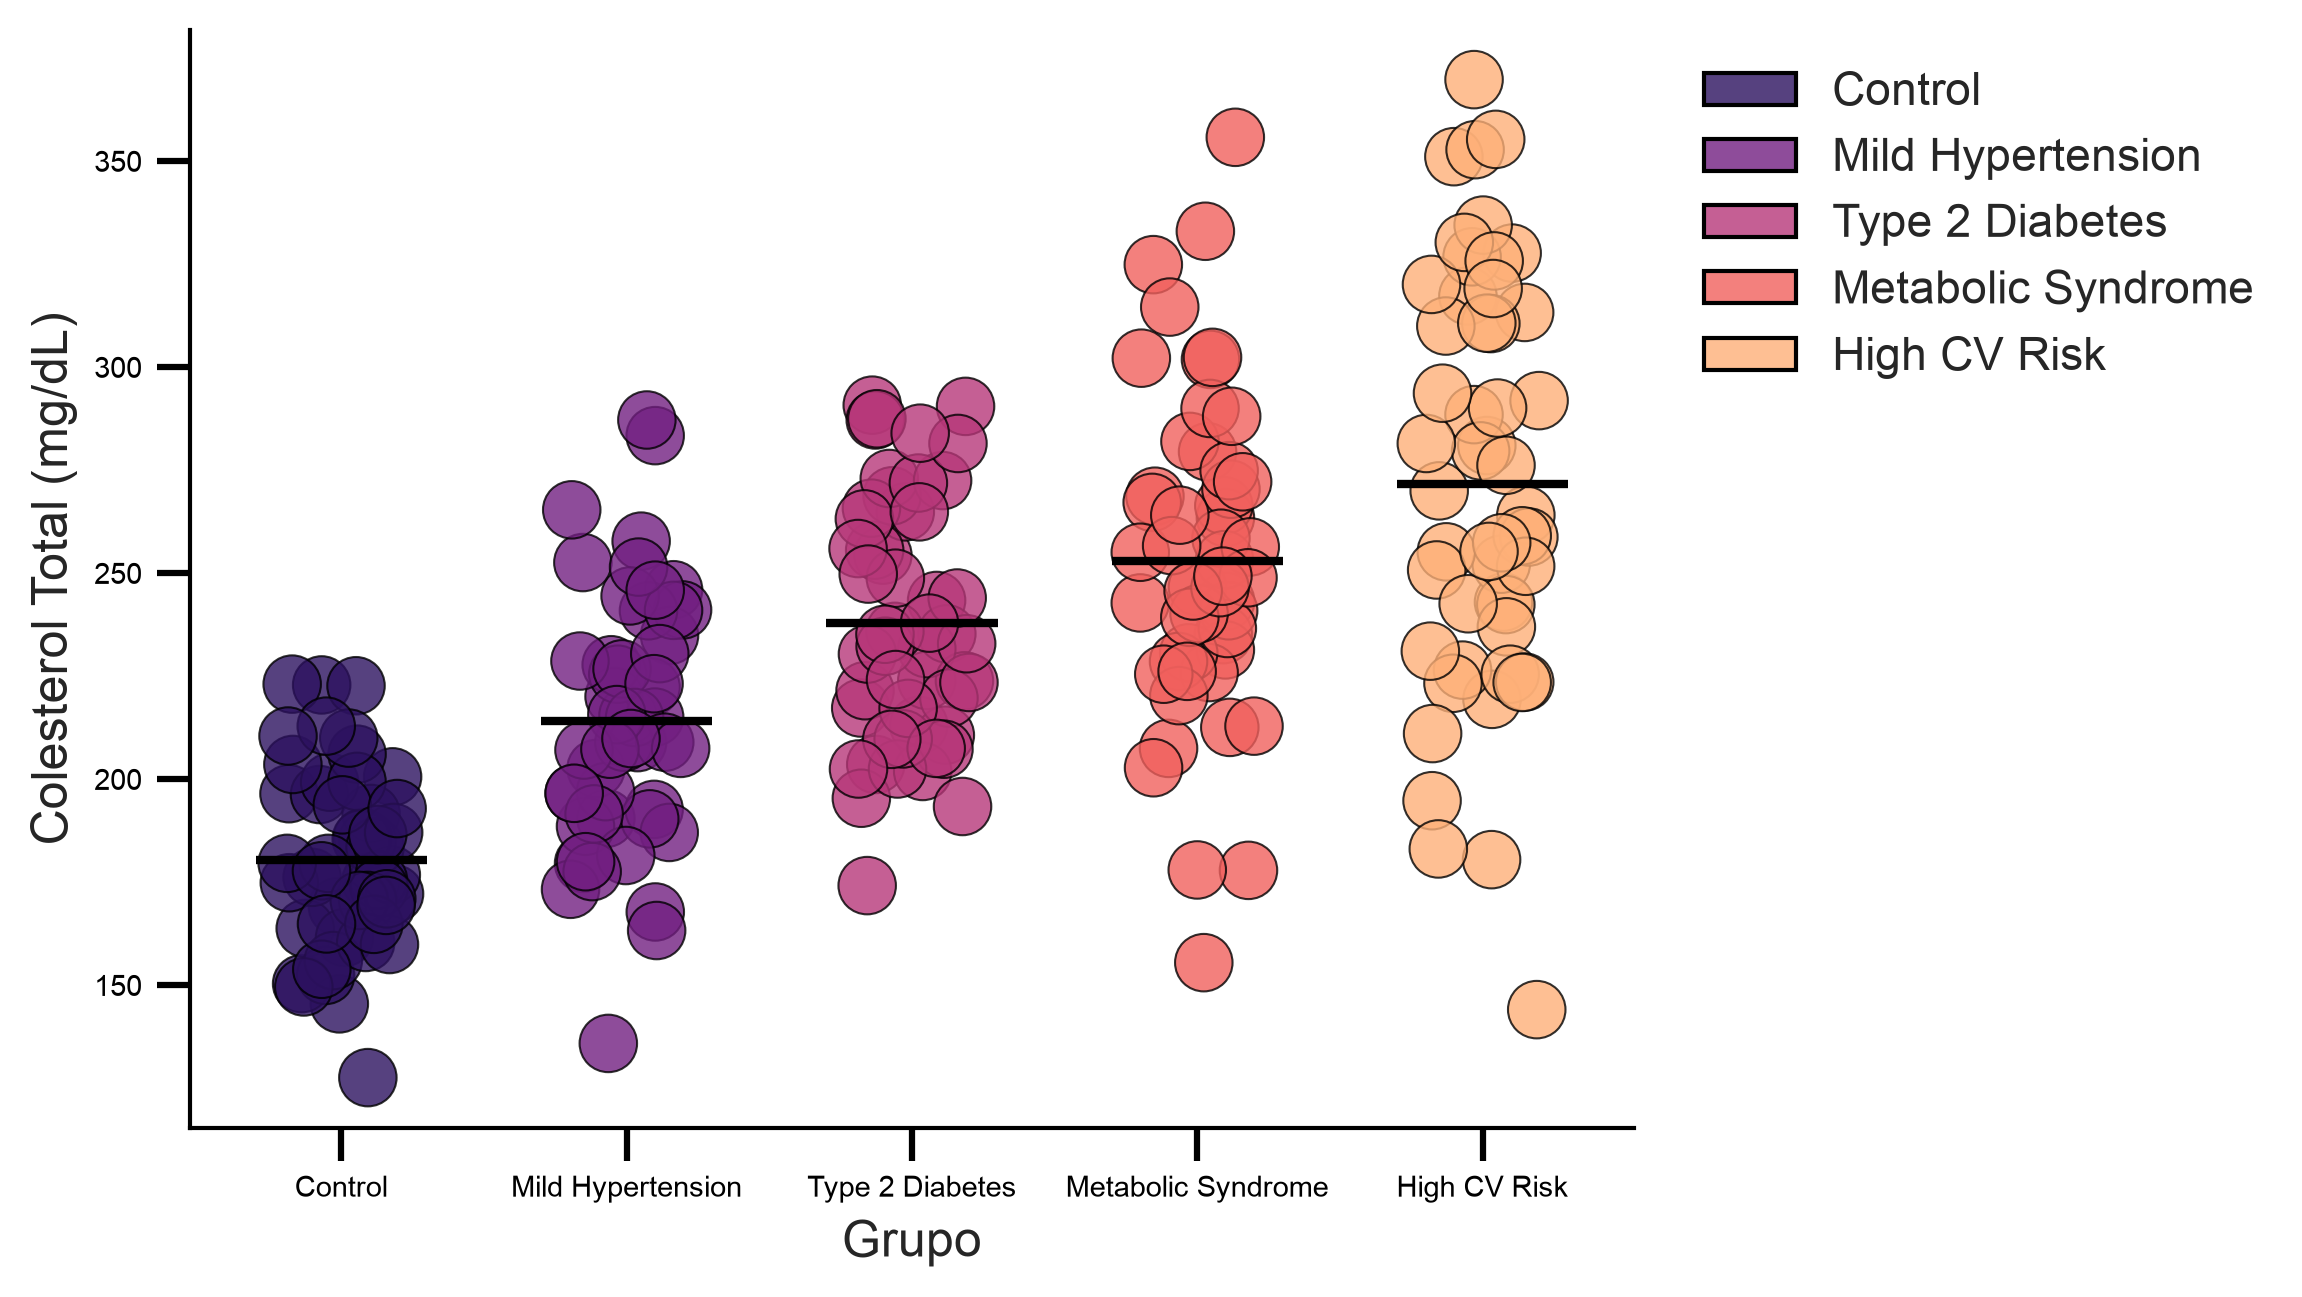
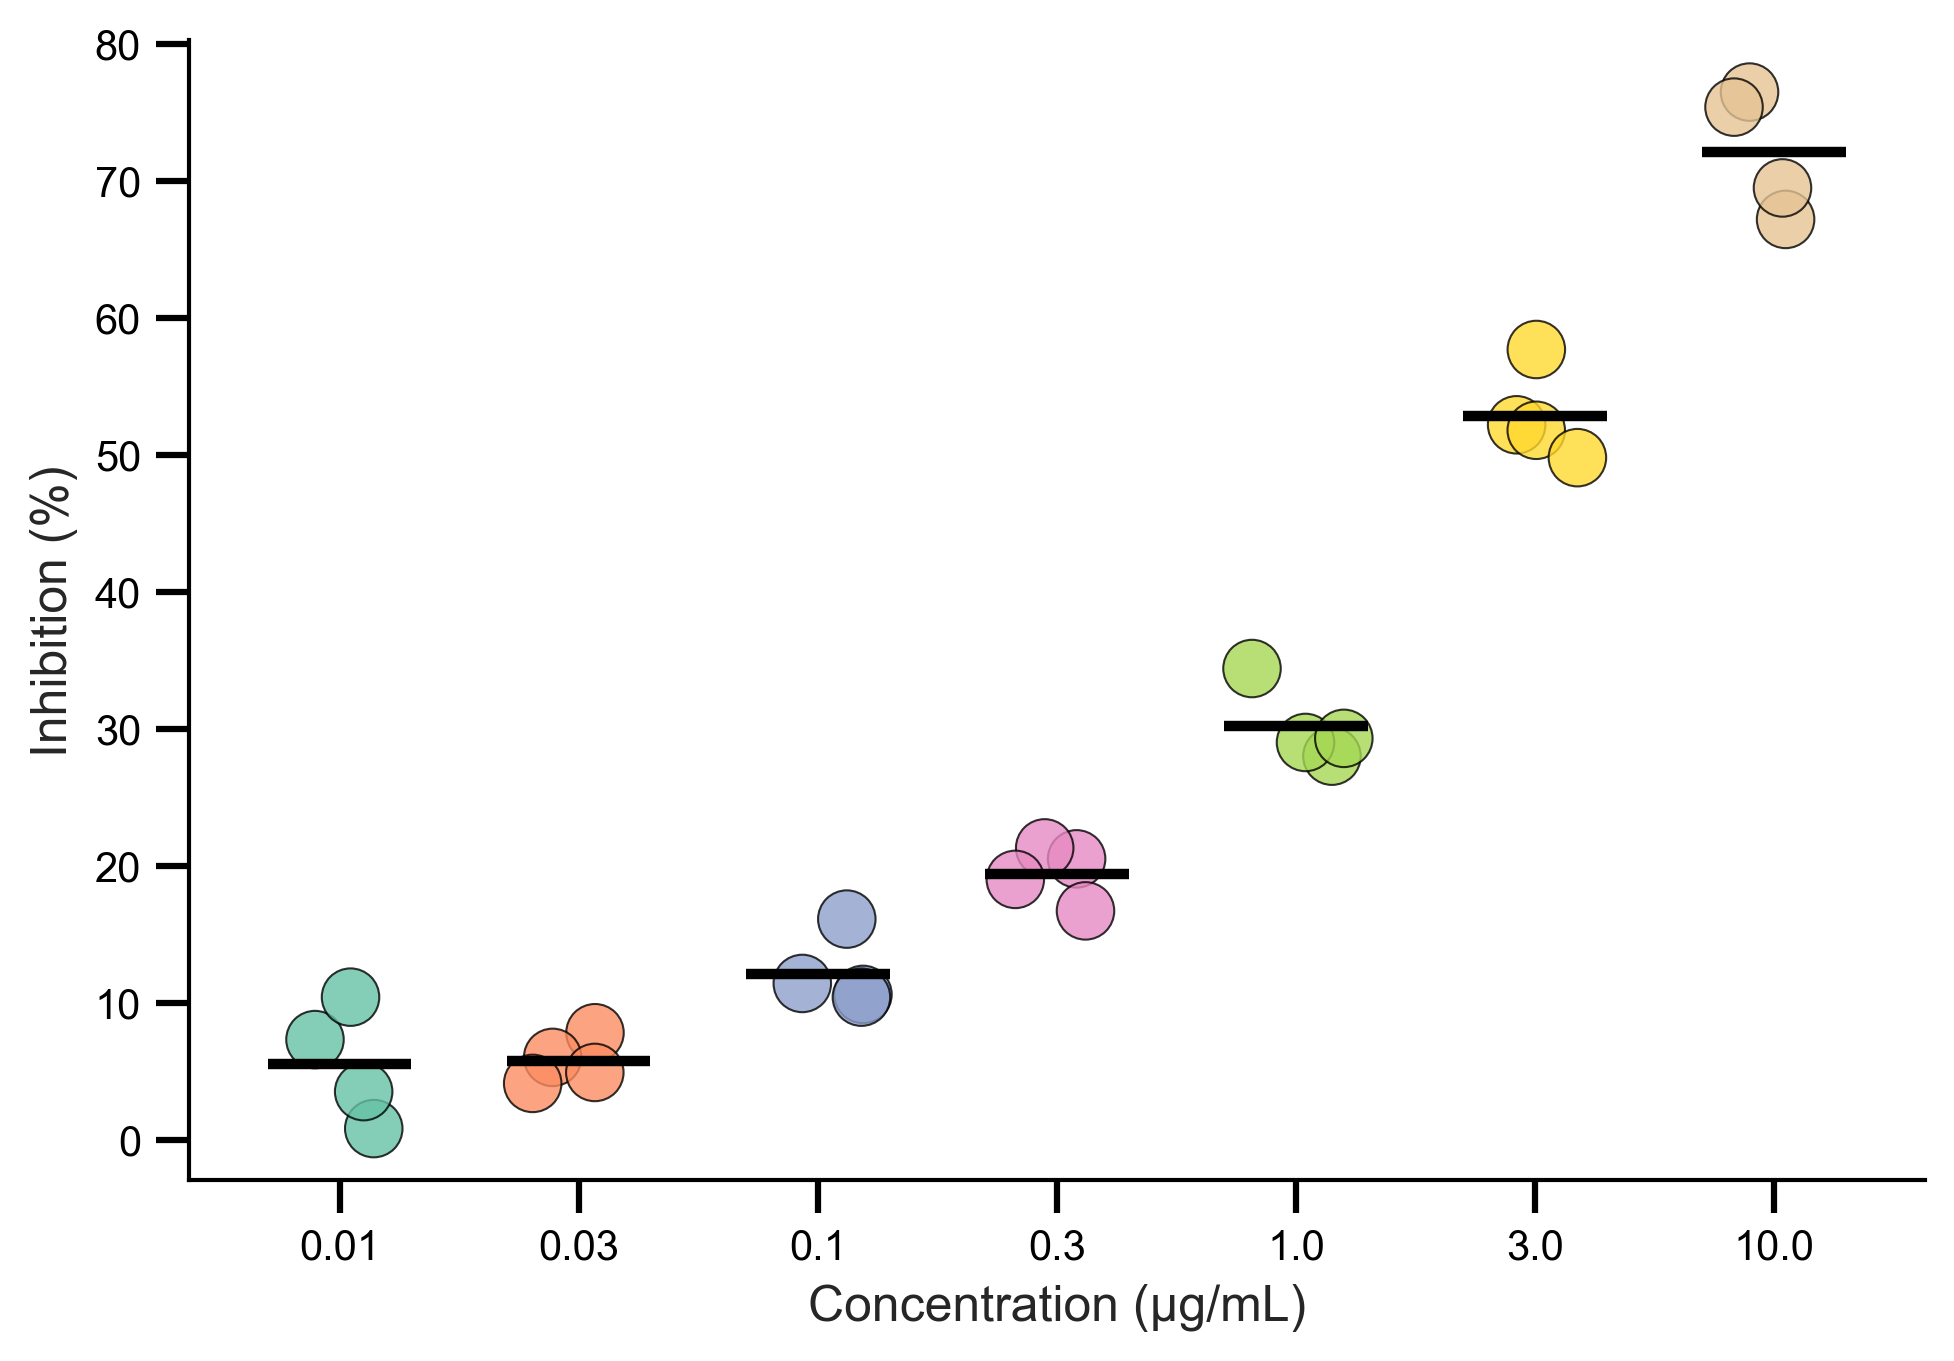
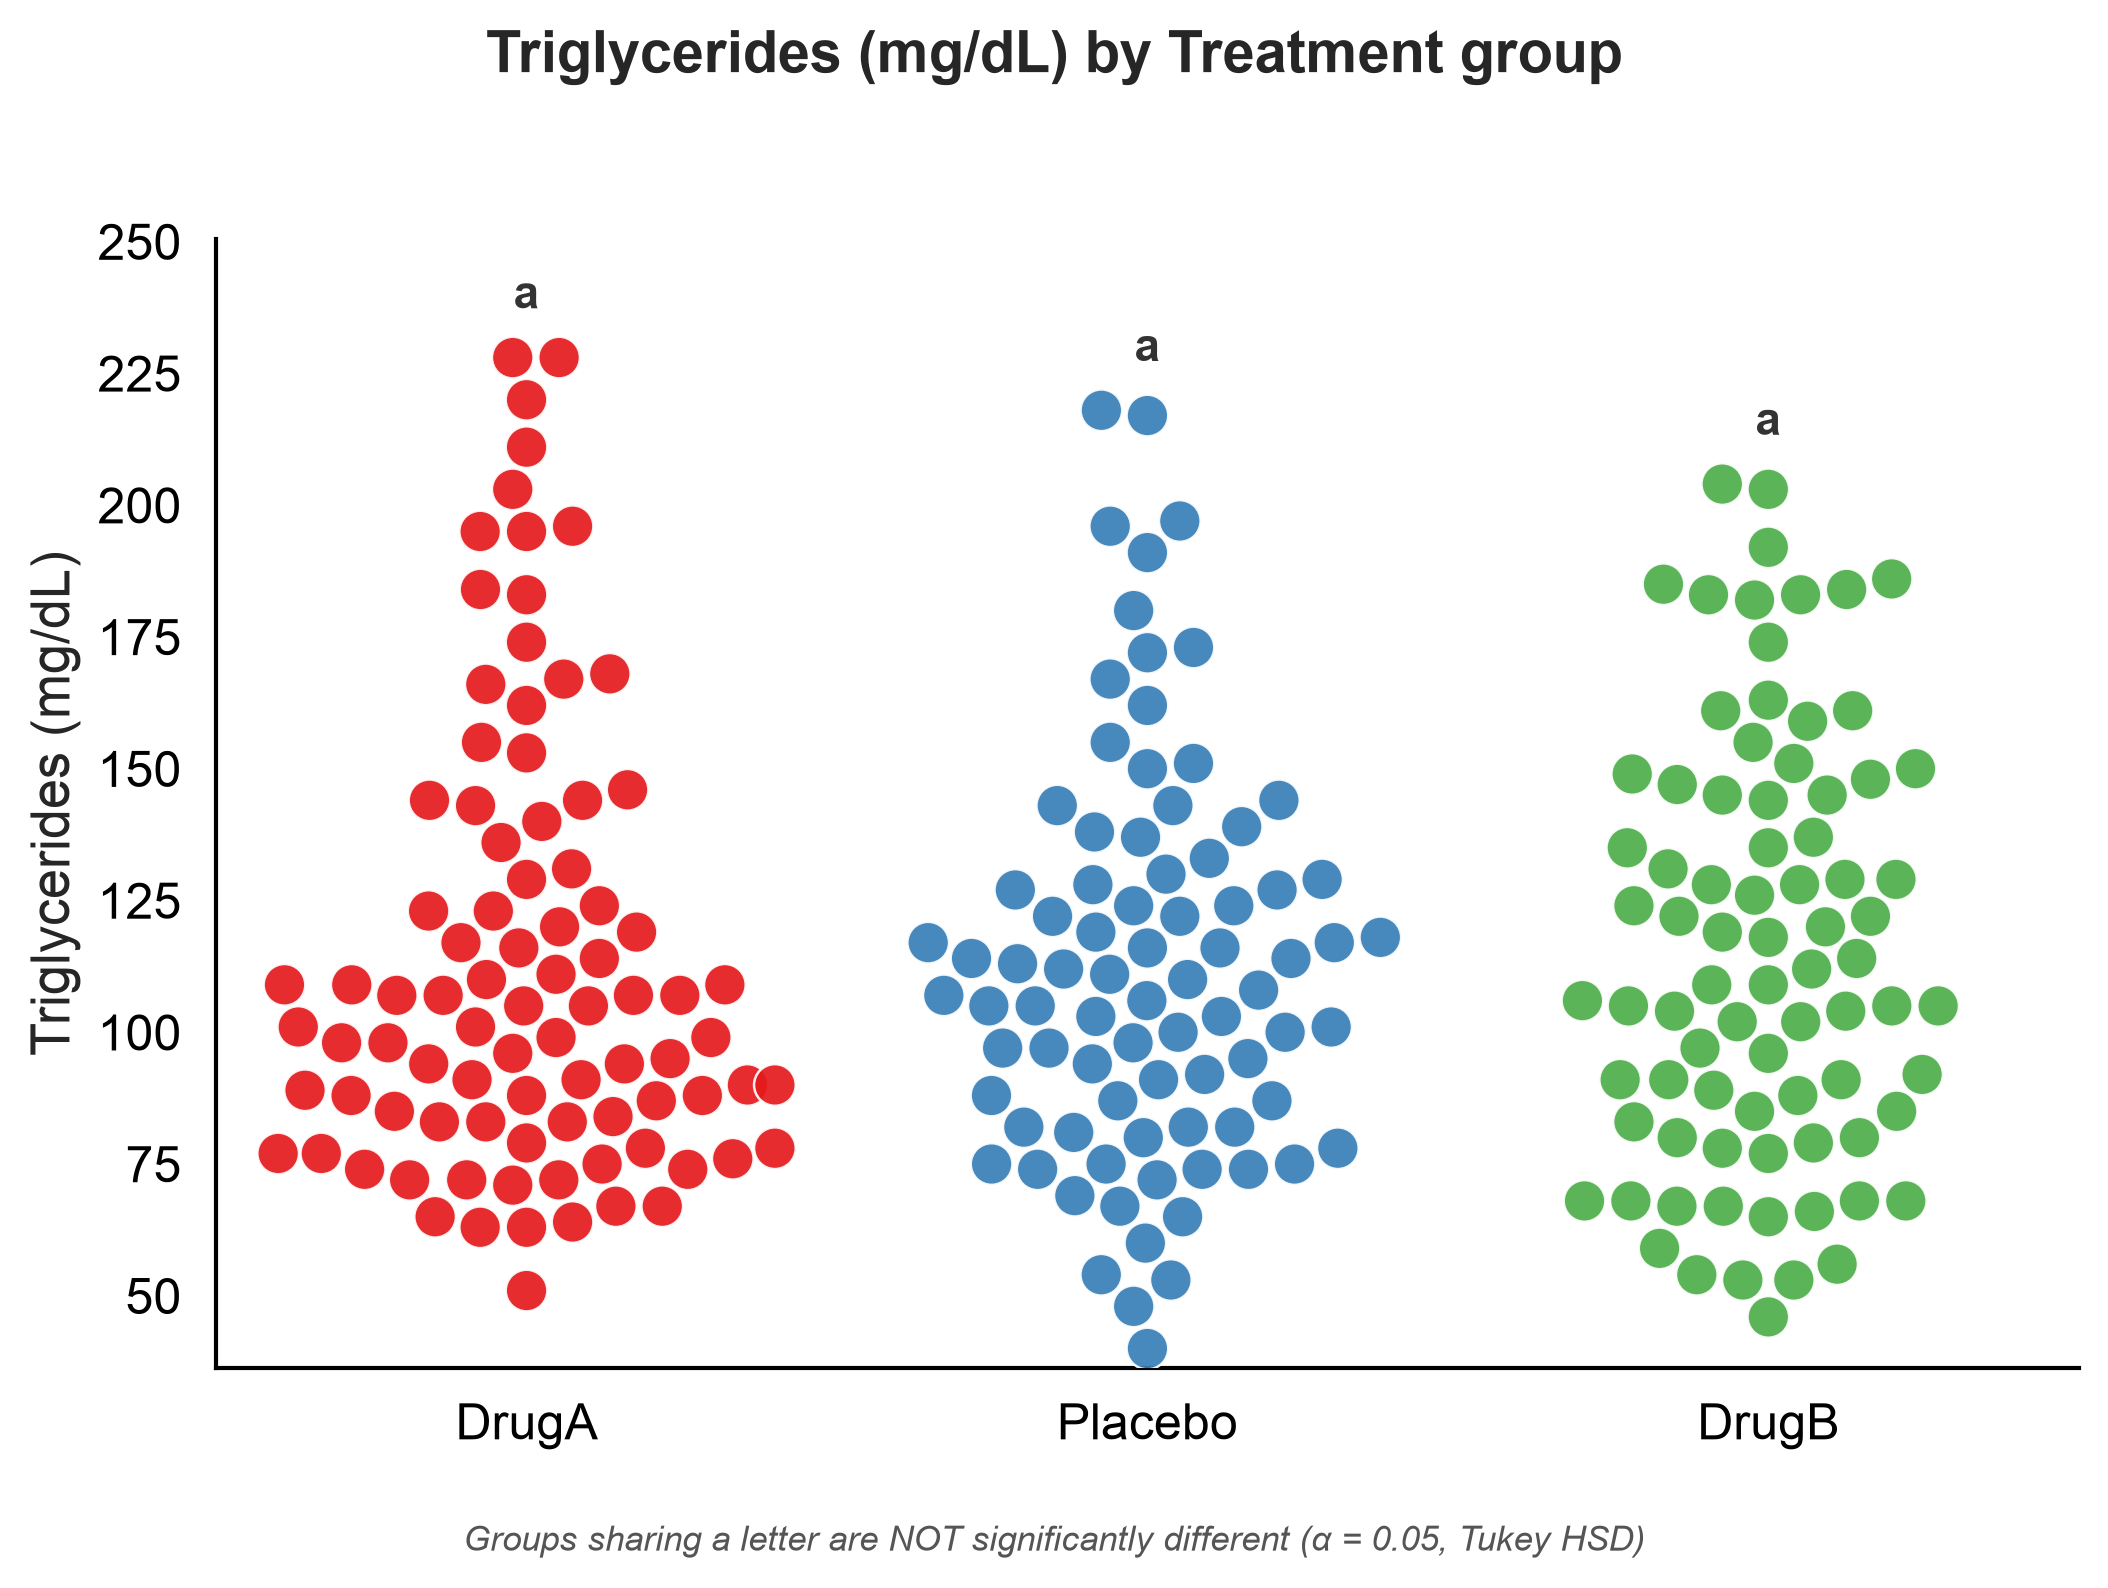
Dot plot

chat Magic Stat Assistant

Dot plot

Your data, your words — Magic Stat does the work.

0+ features
0statistical domains
0% editorial quality
0click to have AI explain

Loved by researchers

What I loved most was having my favorite AI model look at the results alongside me — suggesting new comparisons, interesting hypotheses and further analyses, and even building the ideal charts inside my workflow. No other software on the market does this.

My nightmare was copying and pasting tables into Word and formatting them for hours. With Magic Stat they're born ready.

I used to suffer with the structural-equation packages in R. Magic Stat lets you draw complex models in a way that's extremely simple and fluid.

Making beautiful charts has never been this easy.

The Report section is my favorite — the sticky notes you can drop right into it make the report feel familiar.

From messages we received by email.

What it does

A statistical arsenal, with the simplicity of an app

From descriptive statistics to advanced structural modeling — all in one place, no plugins, with the rigorous output your paper demands.

SEM & PLS

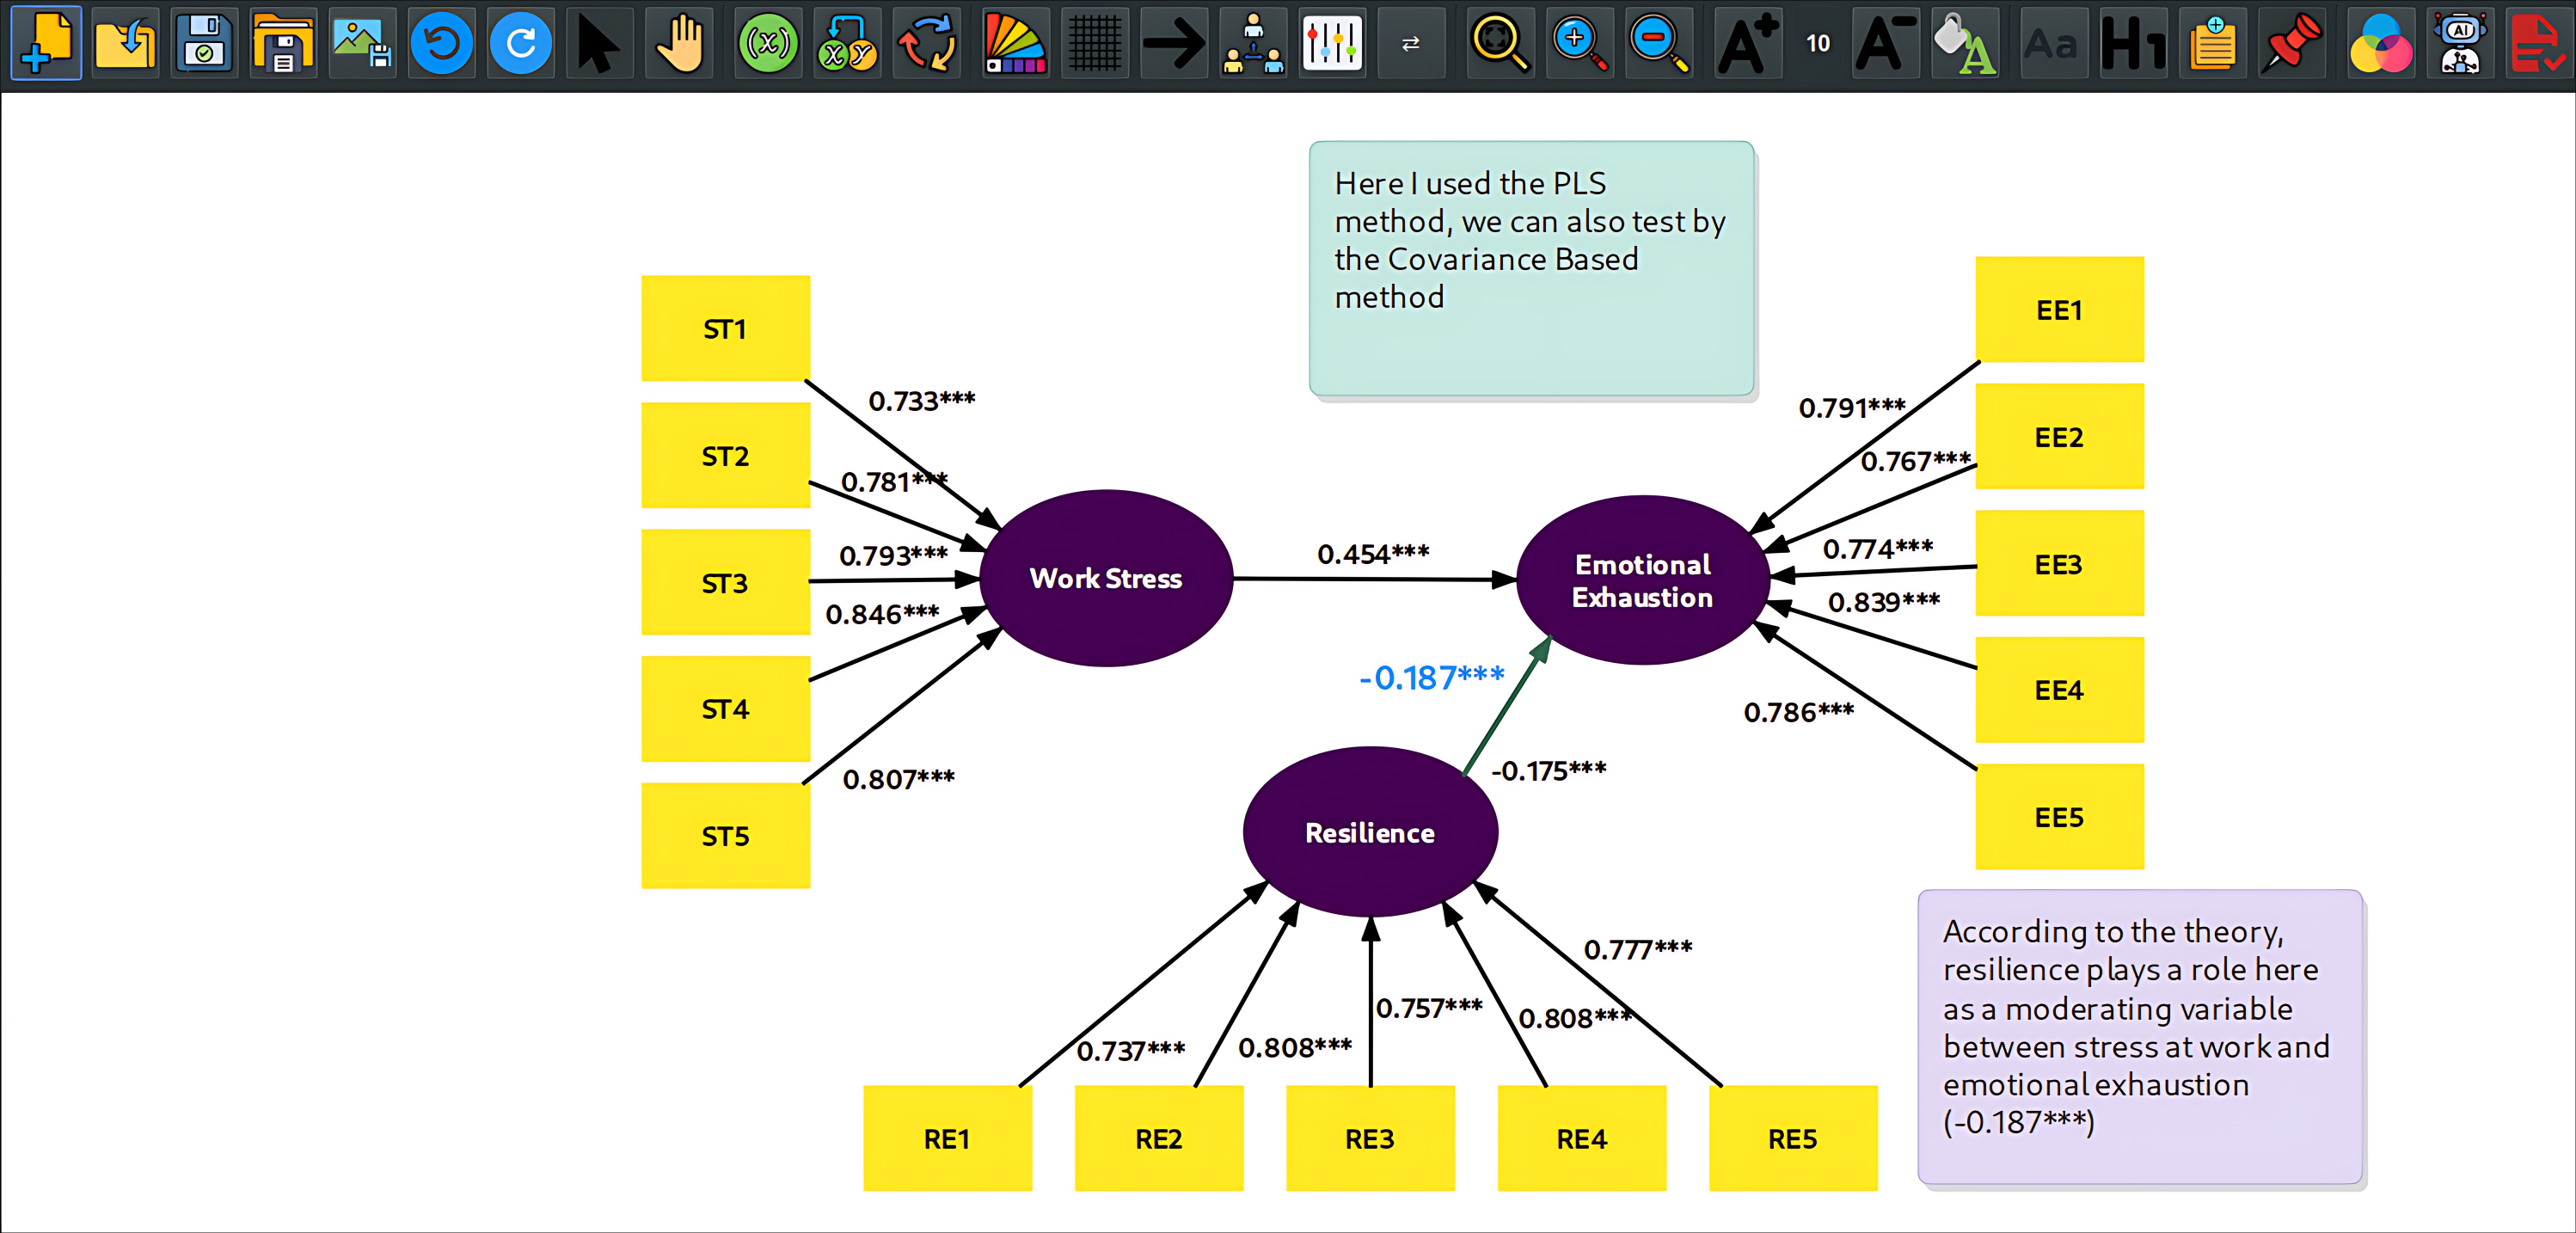
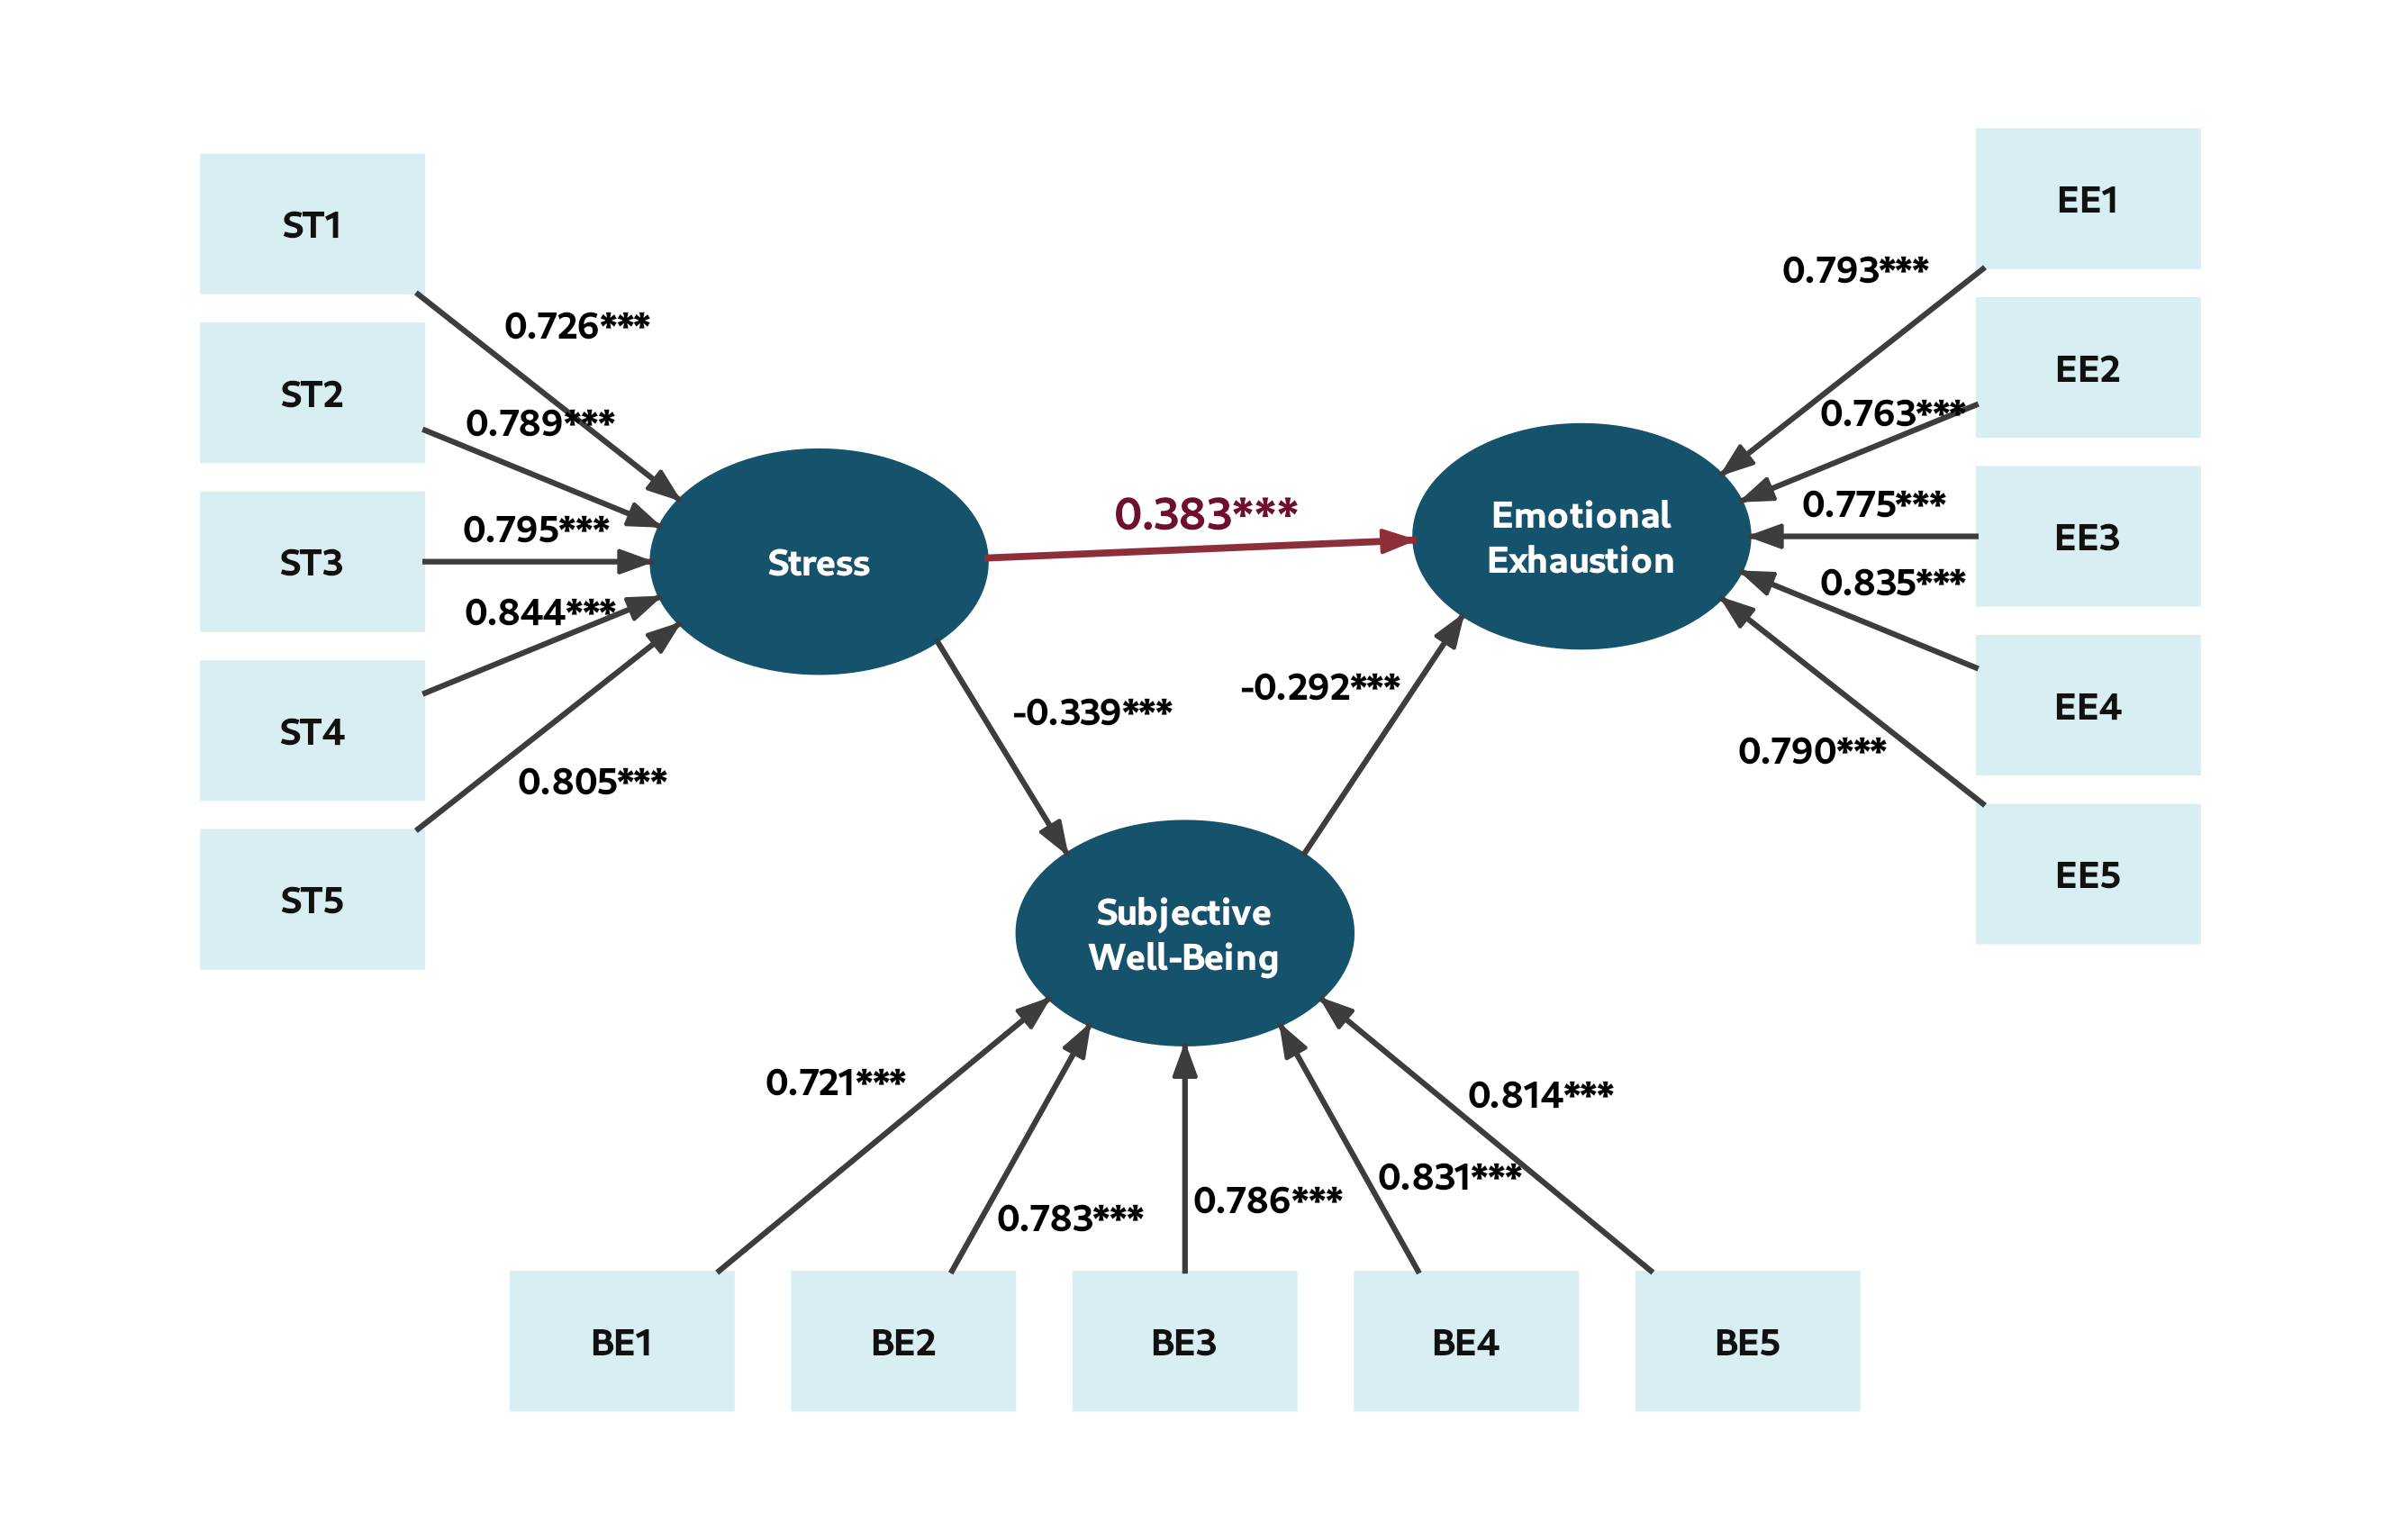
Structural equation modeling and PLS-SEM with a drag-and-drop interface, plus covariance-based path analysis.

  • Editable path diagrams
  • Reliability, validity & HTMT
  • Indirect effects & bootstrapping

Psychometrics

Reliability and construct-validity analysis for psychology and the social sciences.

  • Cronbach's alpha & Omega
  • Factor analysis (EFA)
  • KMO, Bartlett & item-total

Ecology

Biodiversity and community ecology with the canonical metrics.

  • Alpha and beta diversity
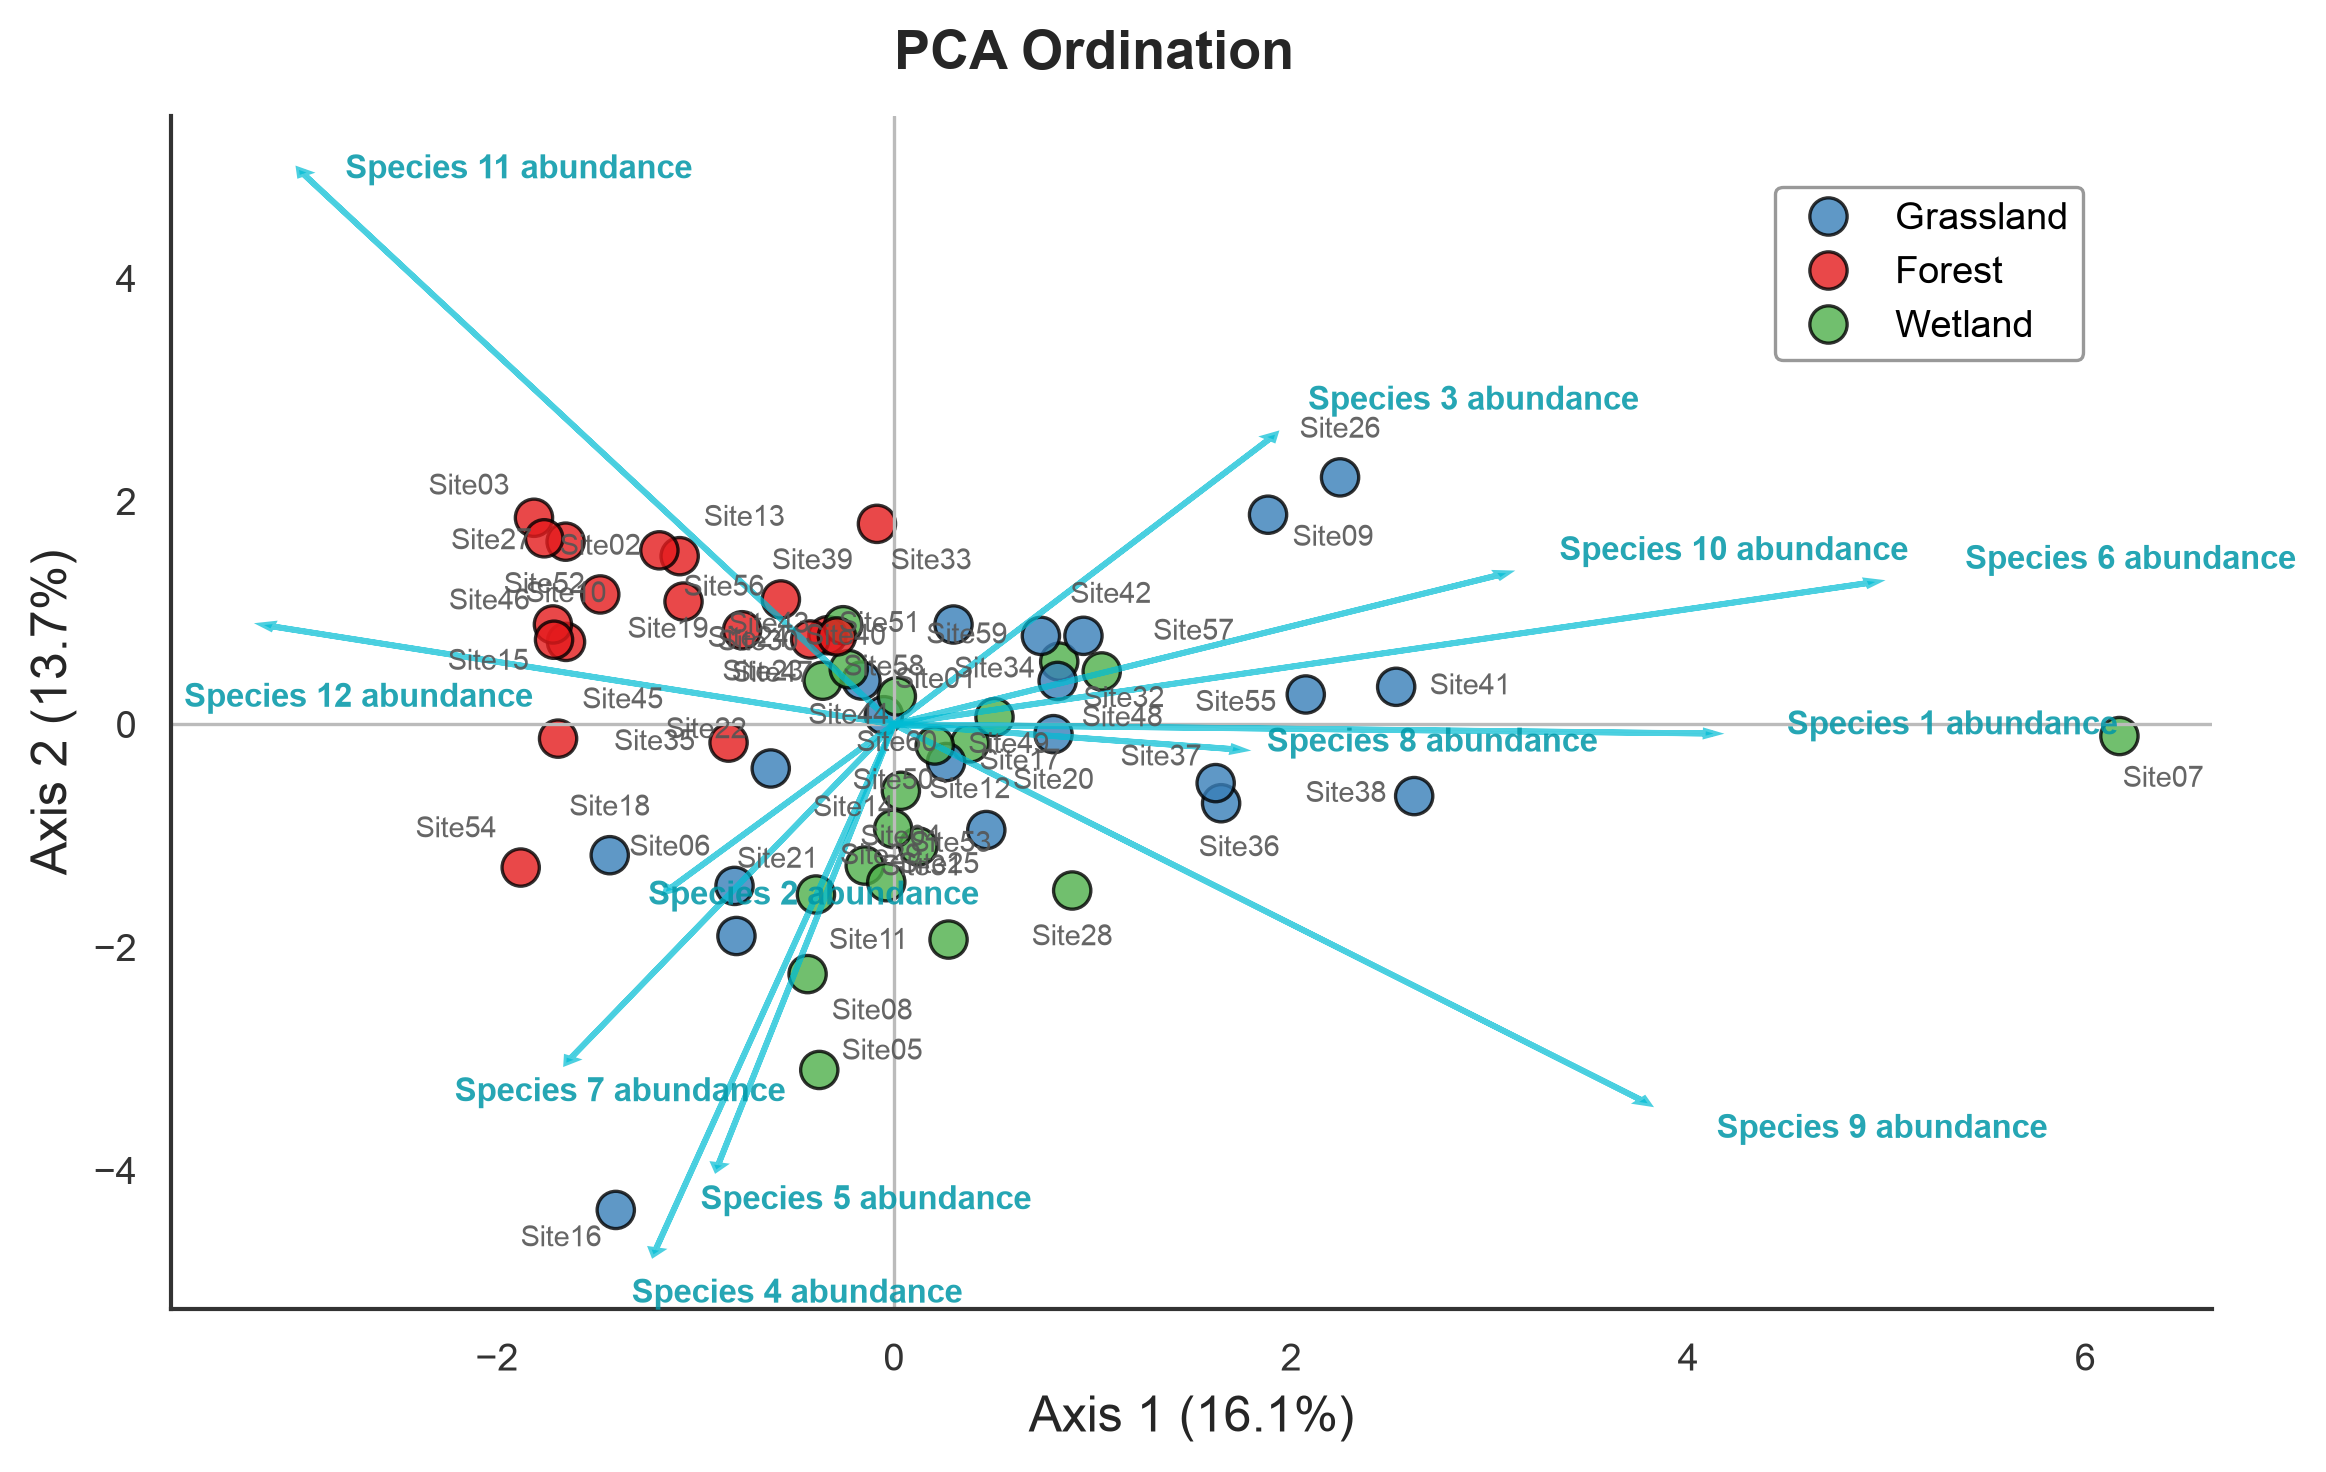
  • Ordination analysis
  • Functional & phylogenetic diversity

Species distribution modeling

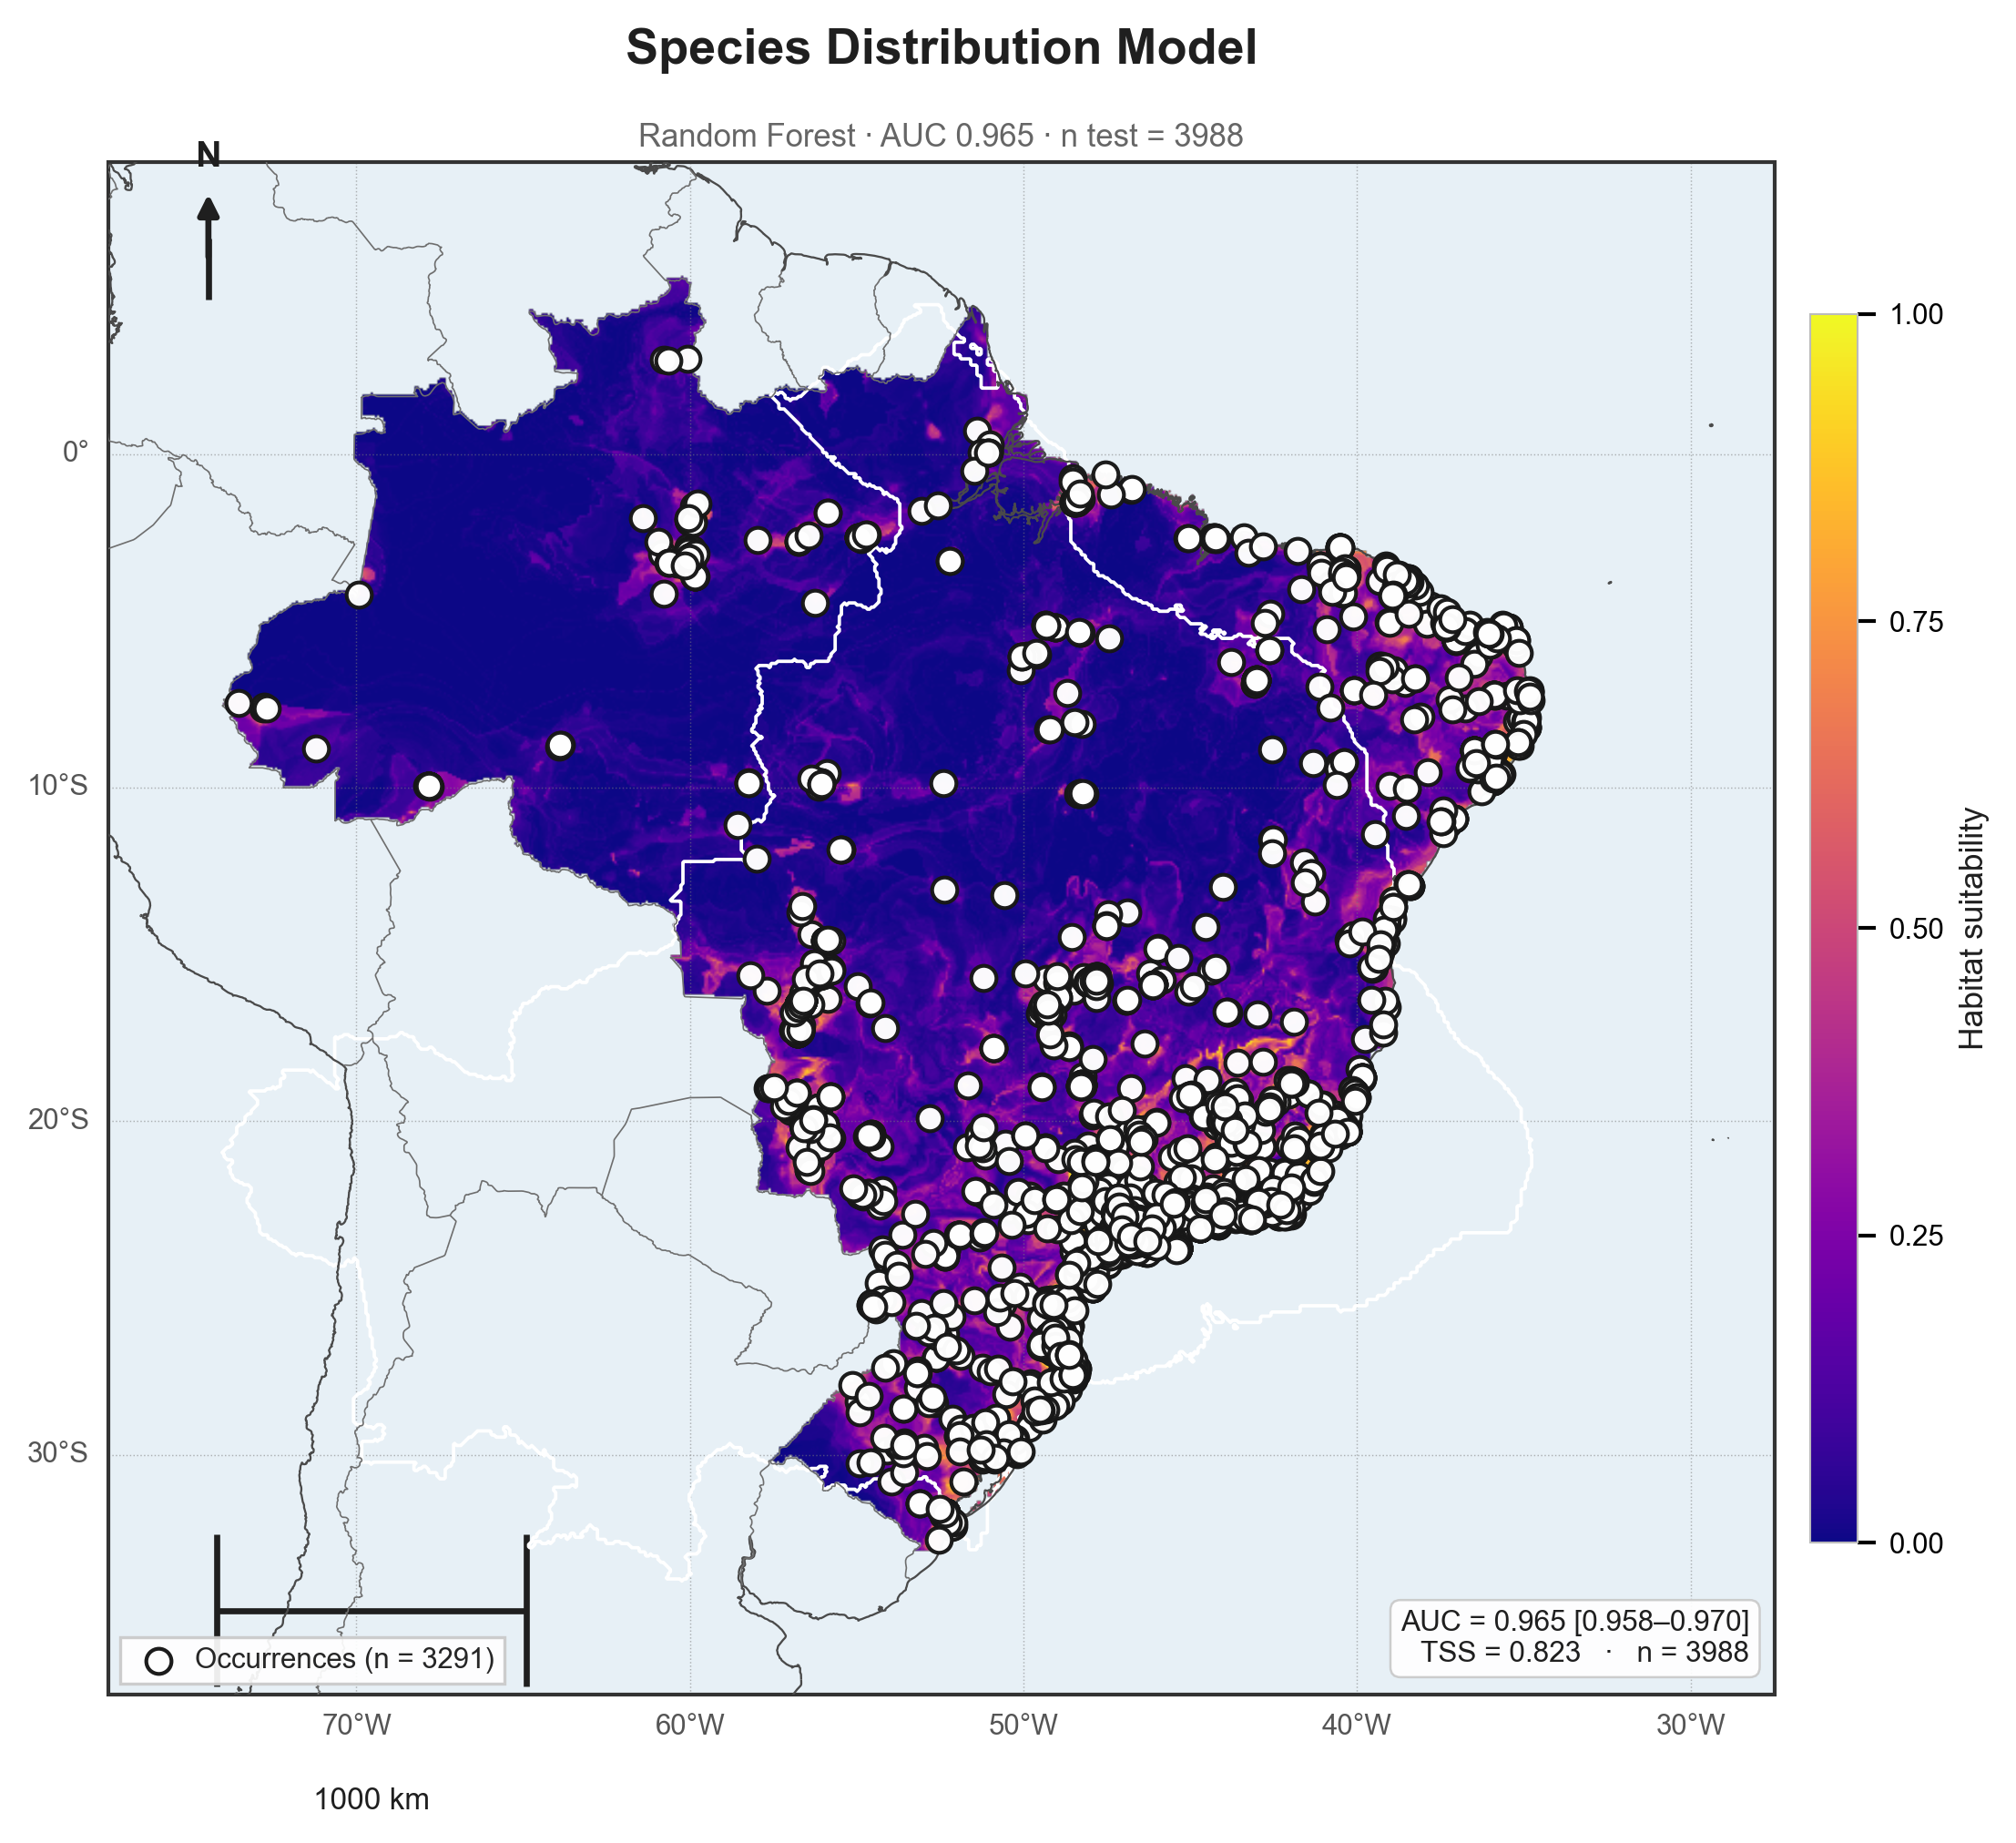
From occurrence points to habitat-suitability maps in a few clicks.

  • Occurrence points + environmental rasters
  • Model ensemble with automatic evaluation
  • High-resolution suitability maps

Time series

Forecasting and decomposition for data over time.

  • Holt-Winters, Theta, ARIMA
  • STL decomposition
  • ACF/PACF & stationarity tests

Dynamical systems & chaos

Type equations on screen and explore chaos — from ODEs to discrete maps and reaction–diffusion systems.

  • Bifurcation diagrams & phase portraits
  • Lyapunov spectrum, Poincaré & basins of attraction
  • Chaos detection in real time series

Mixed models

Fixed and random effects for clustered and repeated-measures data.

  • Random intercepts
  • Repeated-measures ANOVA
  • Mixed designs

Generalized & nonlinear models

Advanced regression families for counts, categories and curved relationships.

  • Poisson & multinomial logistic
  • GAM, GEE & GLM
  • Nonlinear (nls) & robust (Theil–Sen)

Medical statistics

Tools built for clinical and diagnostic research.

  • ROC curves & AUC (DeLong)
  • Bland-Altman & Kaplan-Meier
  • Cohen's Kappa & diagnostic tests

Econometrics

The applied-econometrics toolbox for impact, panel and volatility studies.

  • Panel data, differences-in-differences & structural breaks
  • 2SLS, SUR & GARCH family
  • Granger causality & cointegration

Multivariate

Dimensionality reduction and ordination for any field.

  • PCA, PCoA, NMDS
  • CA, DCA, RDA, CCA
  • PERMANOVA & MANOVA
  • Cluster analysis & discriminant (LDA)

Spatial analysis

Autocorrelation, clusters and regression for georeferenced data.

  • Moran's I, LISA & correlograms
  • Variograms & interpolation maps
  • GWR & spatial regression (SAR/CAR)

Meta-analysis

Combine and quantify evidence across multiple studies.

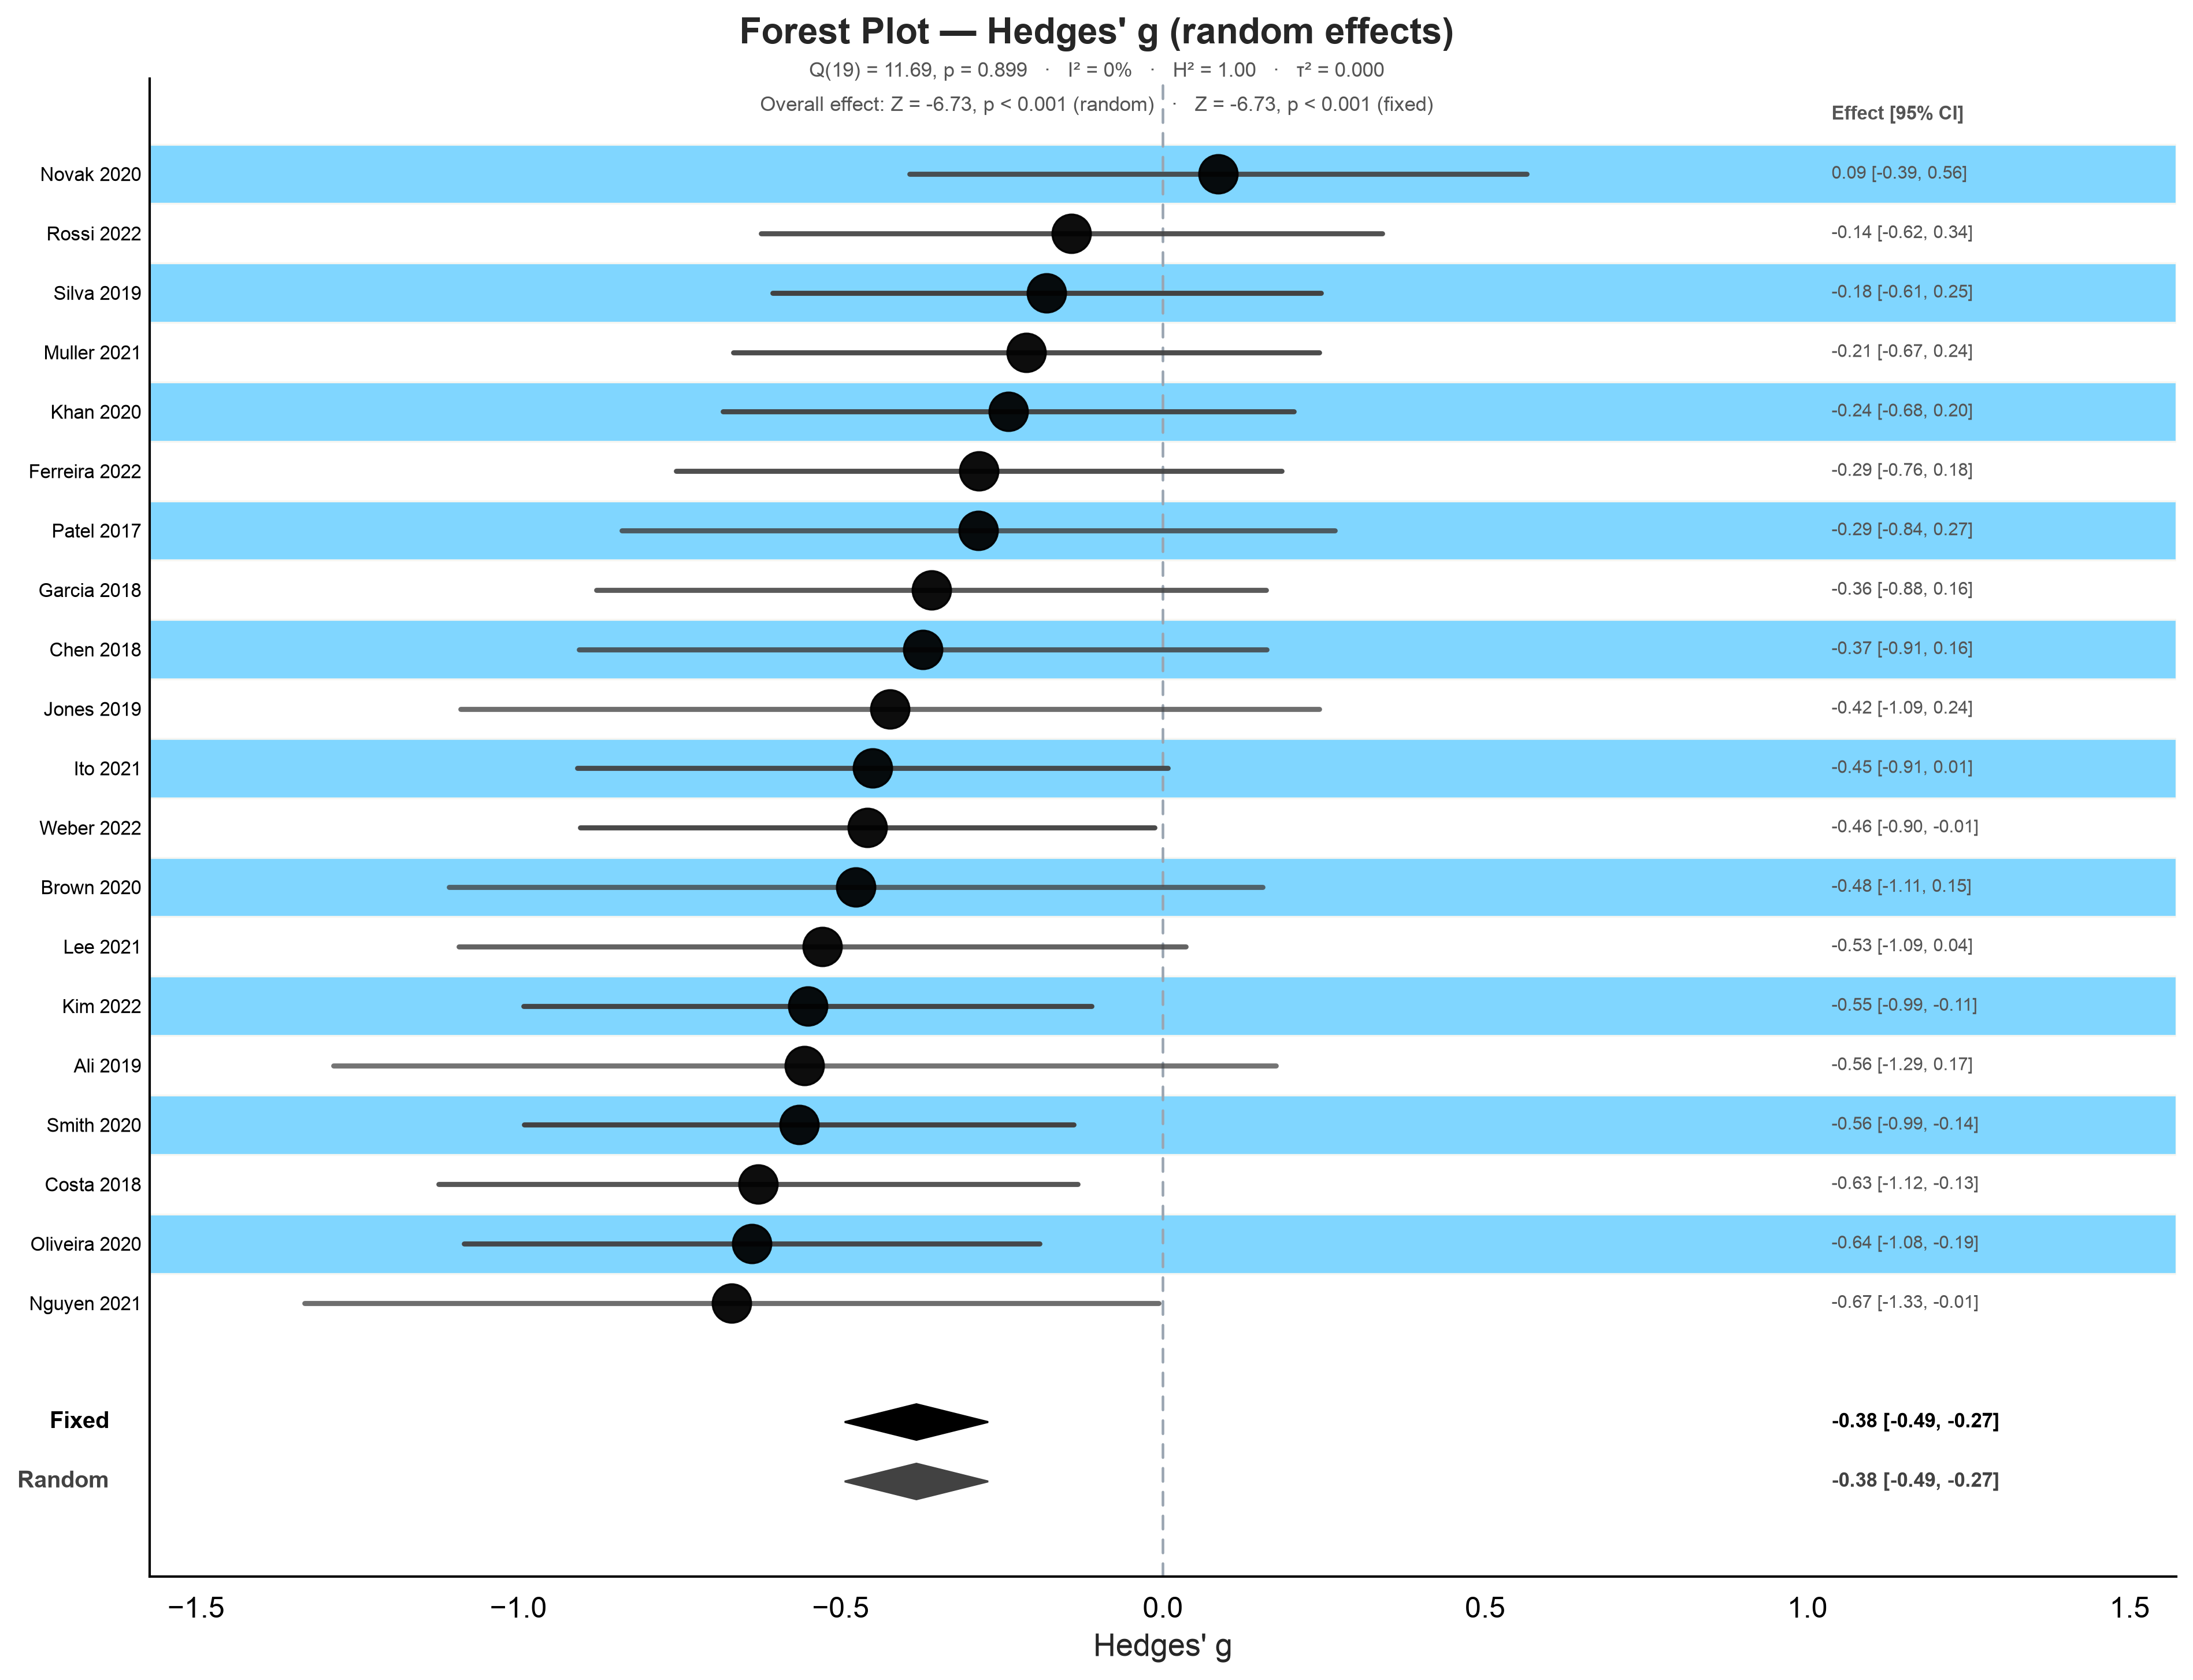
  • Forest & funnel plots
  • Heterogeneity (I², τ²)
  • Egger's test & sensitivity

Power analysis

Plan your study with the ideal sample size.

  • t, ANOVA, correlation, chi-square
  • Regression & SEM
  • Power curves & sample-size tables

Bayesian statistics

Inference with Bayes factors and credible intervals.

  • JZS BF for t, ANOVA, correlation & regression
  • HDI / ROPE
  • Posteriors

Regression & correlation

From simple to flexible.

  • Simple, multiple, polynomial
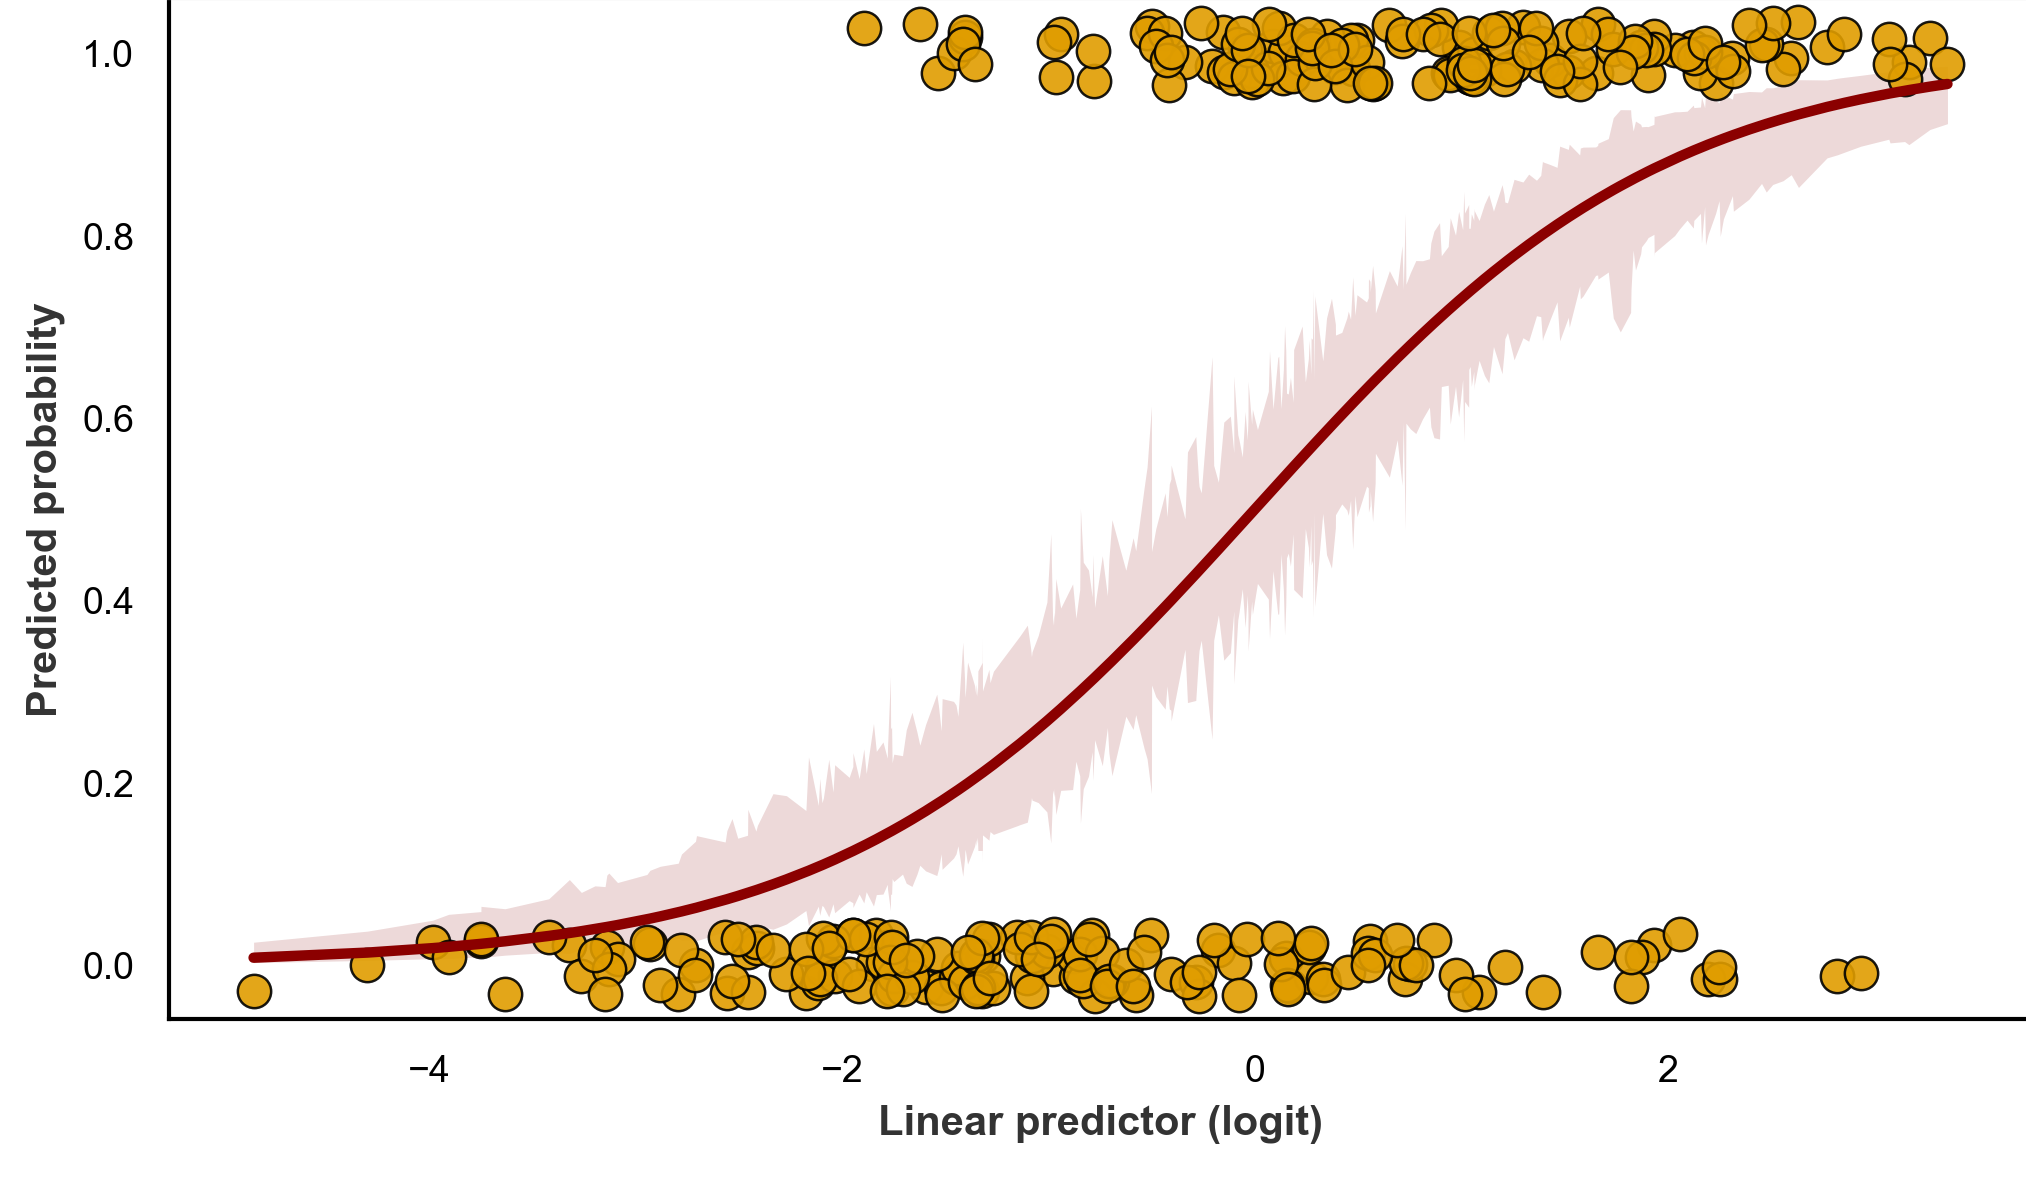
  • Logistic with OR & ROC
  • LOESS, splines, VIF
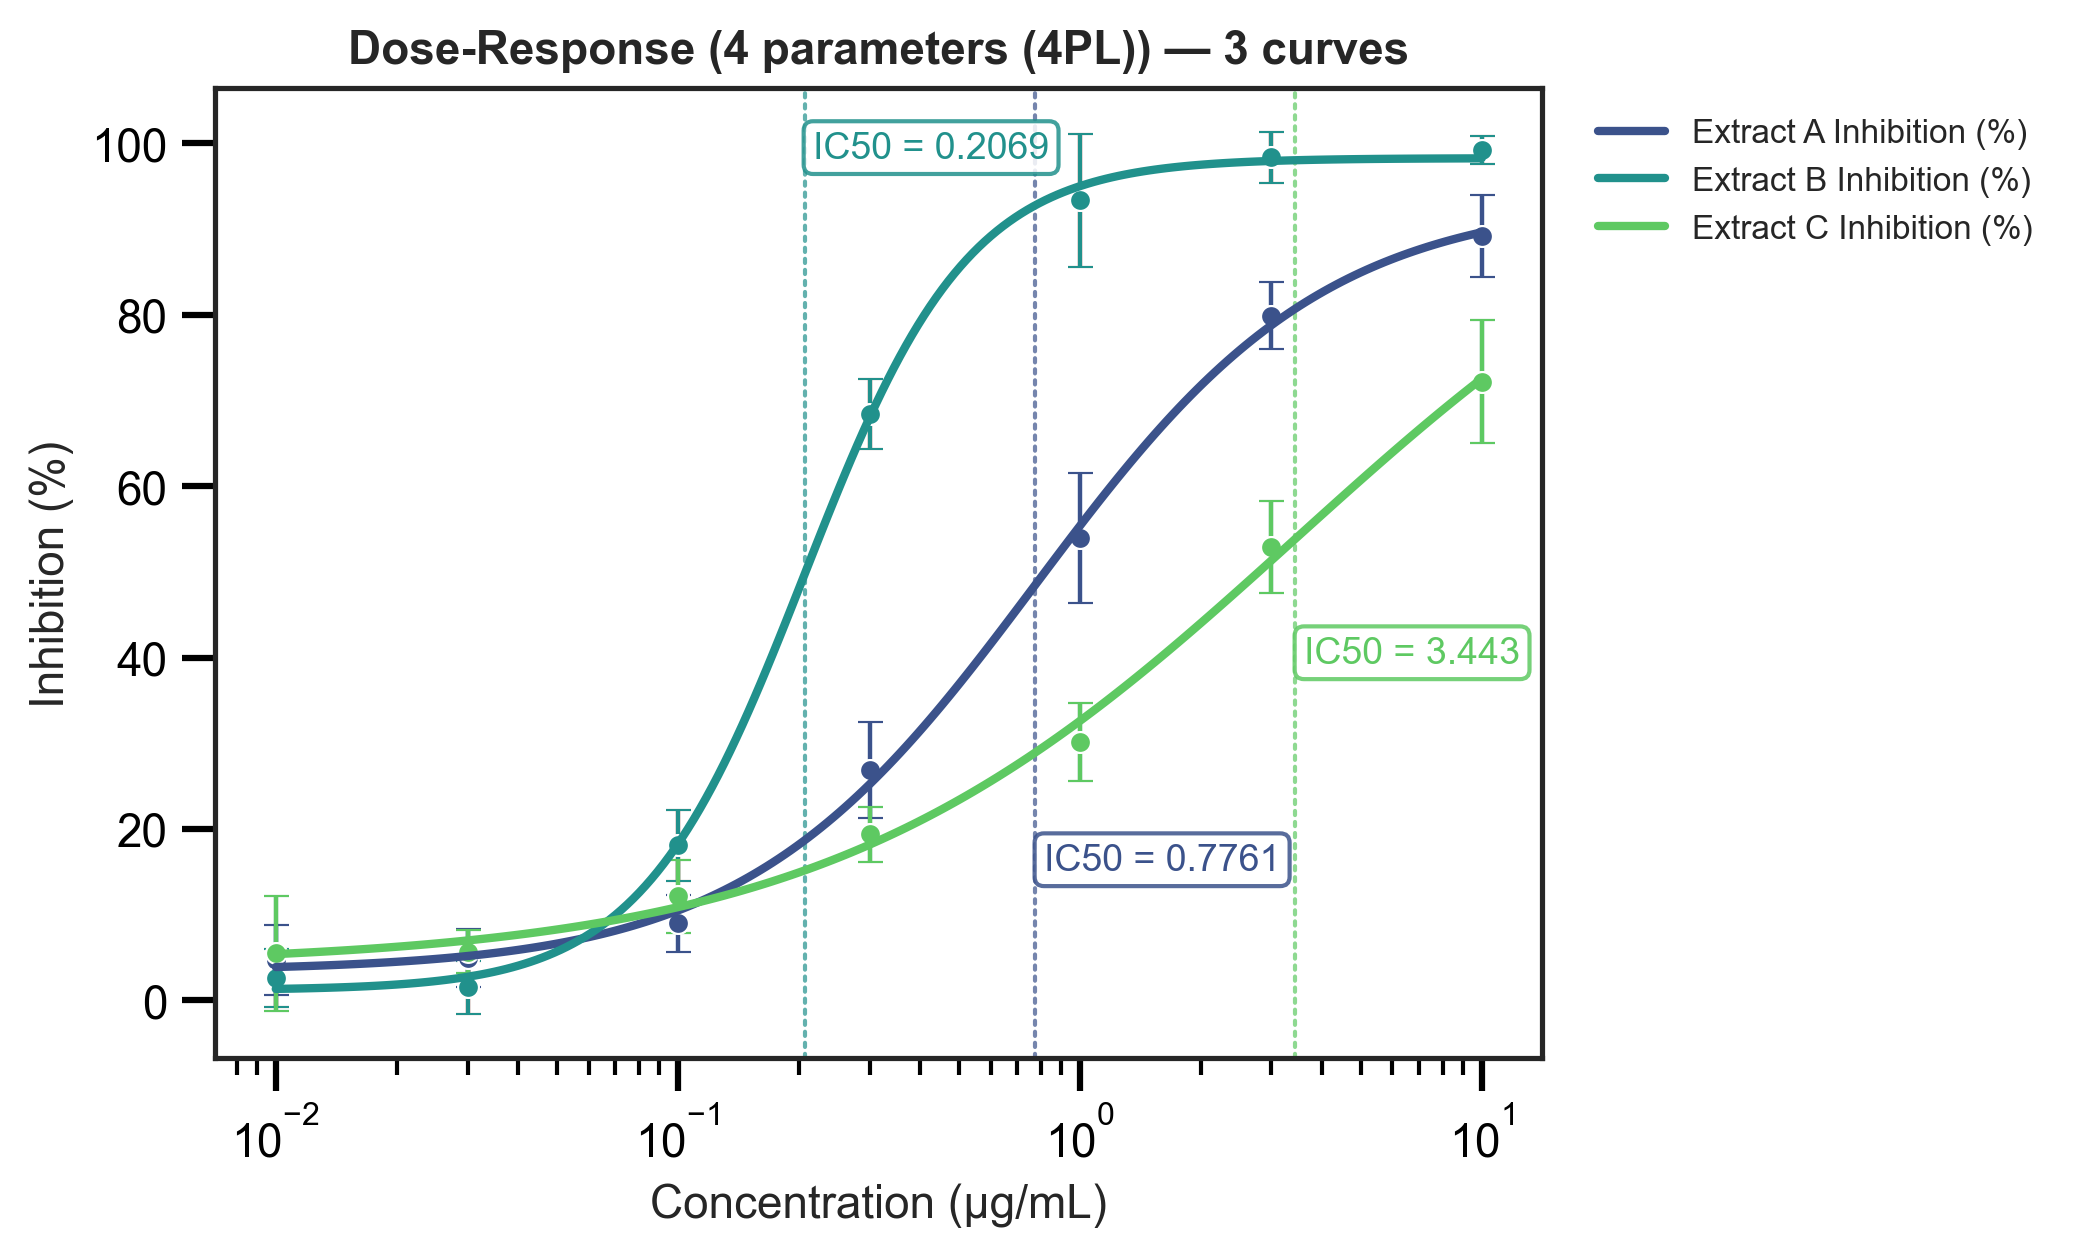
  • Dose-response & area under curve (PK)

Classics

The essentials, refined.

  • Cross-tabulation (χ²)
  • t-tests, ANOVA & post-hoc
  • Descriptives table for your paper

Data preparation

Clean and shape your data before the analysis — all built in, no external tools.

  • Variable dictionary & types
  • Transformations, recoding & missing values
  • Built-in example & synthetic datasets

Equation editor

Write beautiful equations in a WYSIWYG editor with a rich math palette.

  • Live typesetting as you type
  • Calculus, algebra, Greek & more
  • Export PNG, SVG, Word & LibreOffice

Circular graphs

Build complex circular plots with absolute ease.

  • Chord & ribbon diagrams
  • Flow & correlation layouts
  • Publication-ready export
The differentiator

An AI data scientist you already know

Plug in your favorite language model via API — OpenAI, Claude or DeepSeek — and operate the software by conversation. The assistant actually runs Magic Stat for you: it creates figures, runs analyses, builds tables, discusses the results and helps with everything.

  • Your model, your key (BYOK) — bring your own API key; nothing is stored or sent anywhere else.
  • Talk to your data — “explore this dataset”, “compare the groups”, “check the assumptions”.
  • It does the work — the agent opens the right window and executes real analyses, figures and tables.
  • It discusses with you — interprets coefficients, folds, p-values and effect sizes in plain language.
  • Never invents results — it only reports what it actually ran, reading the real numbers from your session.
Plug your favorite: OpenAIClaudeDeepSeek
Smart reports

A report ready for your paper

Forget the raw output of conventional software. Magic Stat generates a formatted report — with tables in scientific format and figures — that can be read and commented on by the AI, and exported already formatted.

  • ✔ APA/editorial-style tables, no rework
  • ✔ Statistically formatted output (p, d, η², BF…)
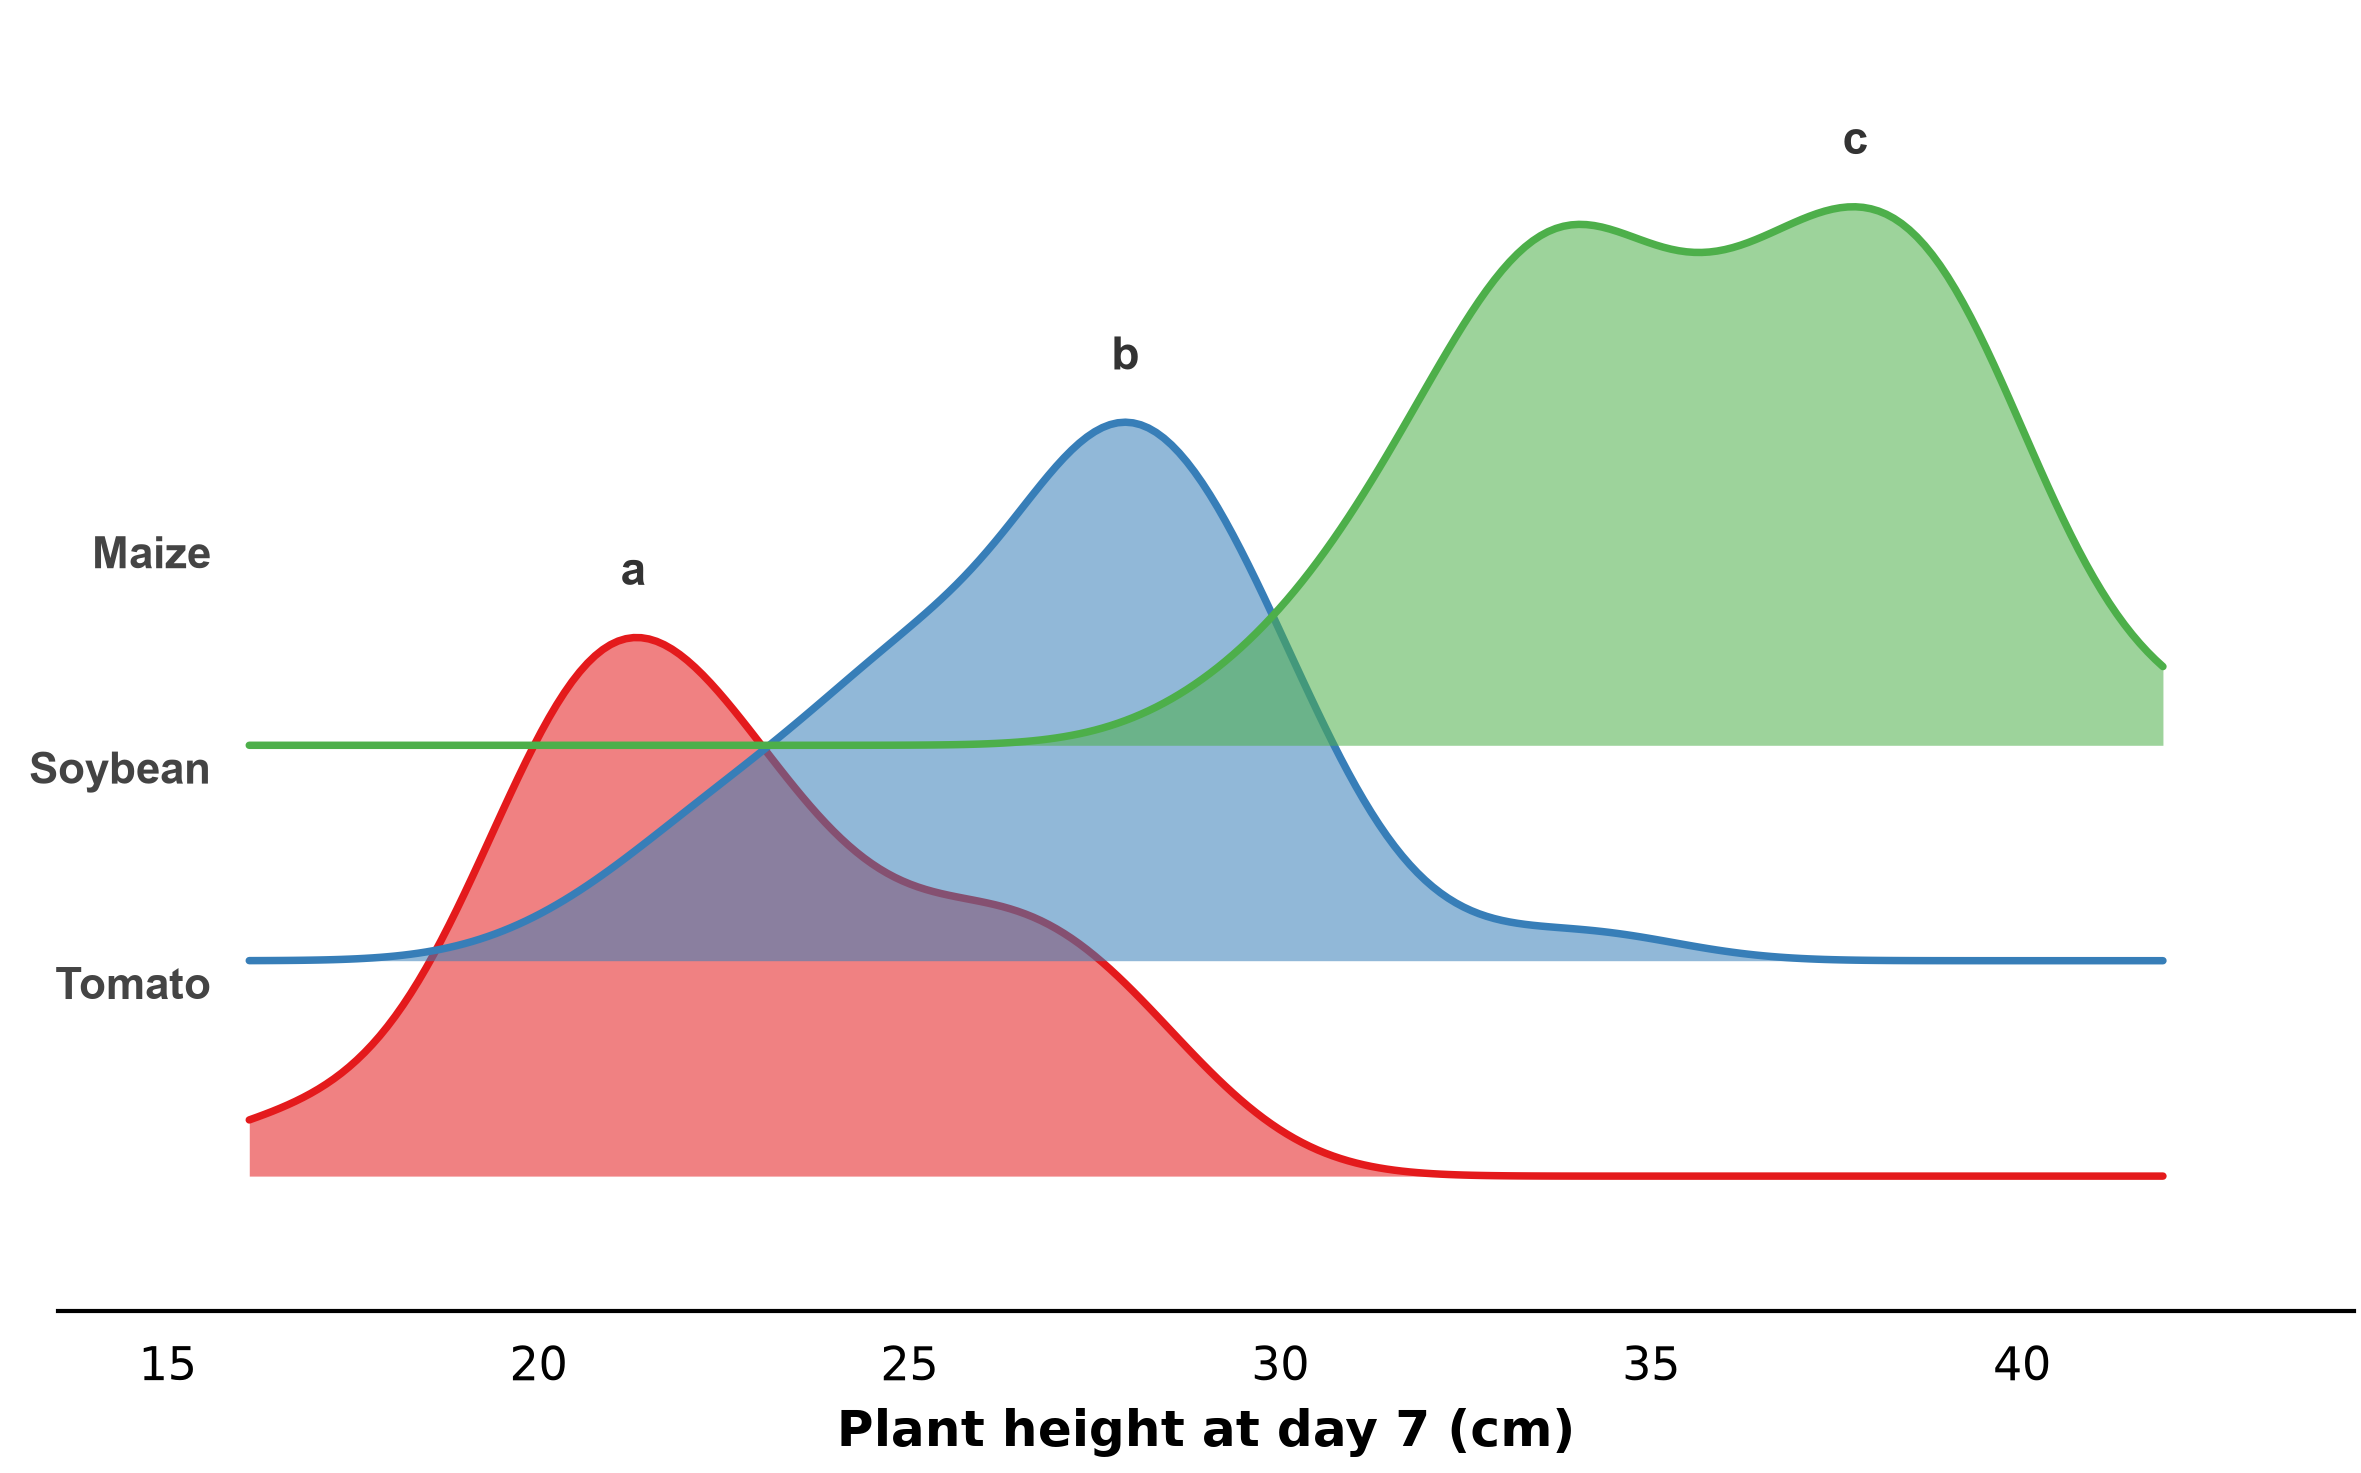
  • ✔ Post-hoc significance letters (Compact Letter Display — a, b, c)
  • ✔ AI comments on every section — integrated review
  • ✔ Export formatted and keep the session for review
table ANOVA + post-hocF(4, 495) = 21.3, p < 0.001, η² = 0.147
Post-hoc (Tukey) Group D: a  Group E: a  Group A: b  Group B: bc  Group C: c
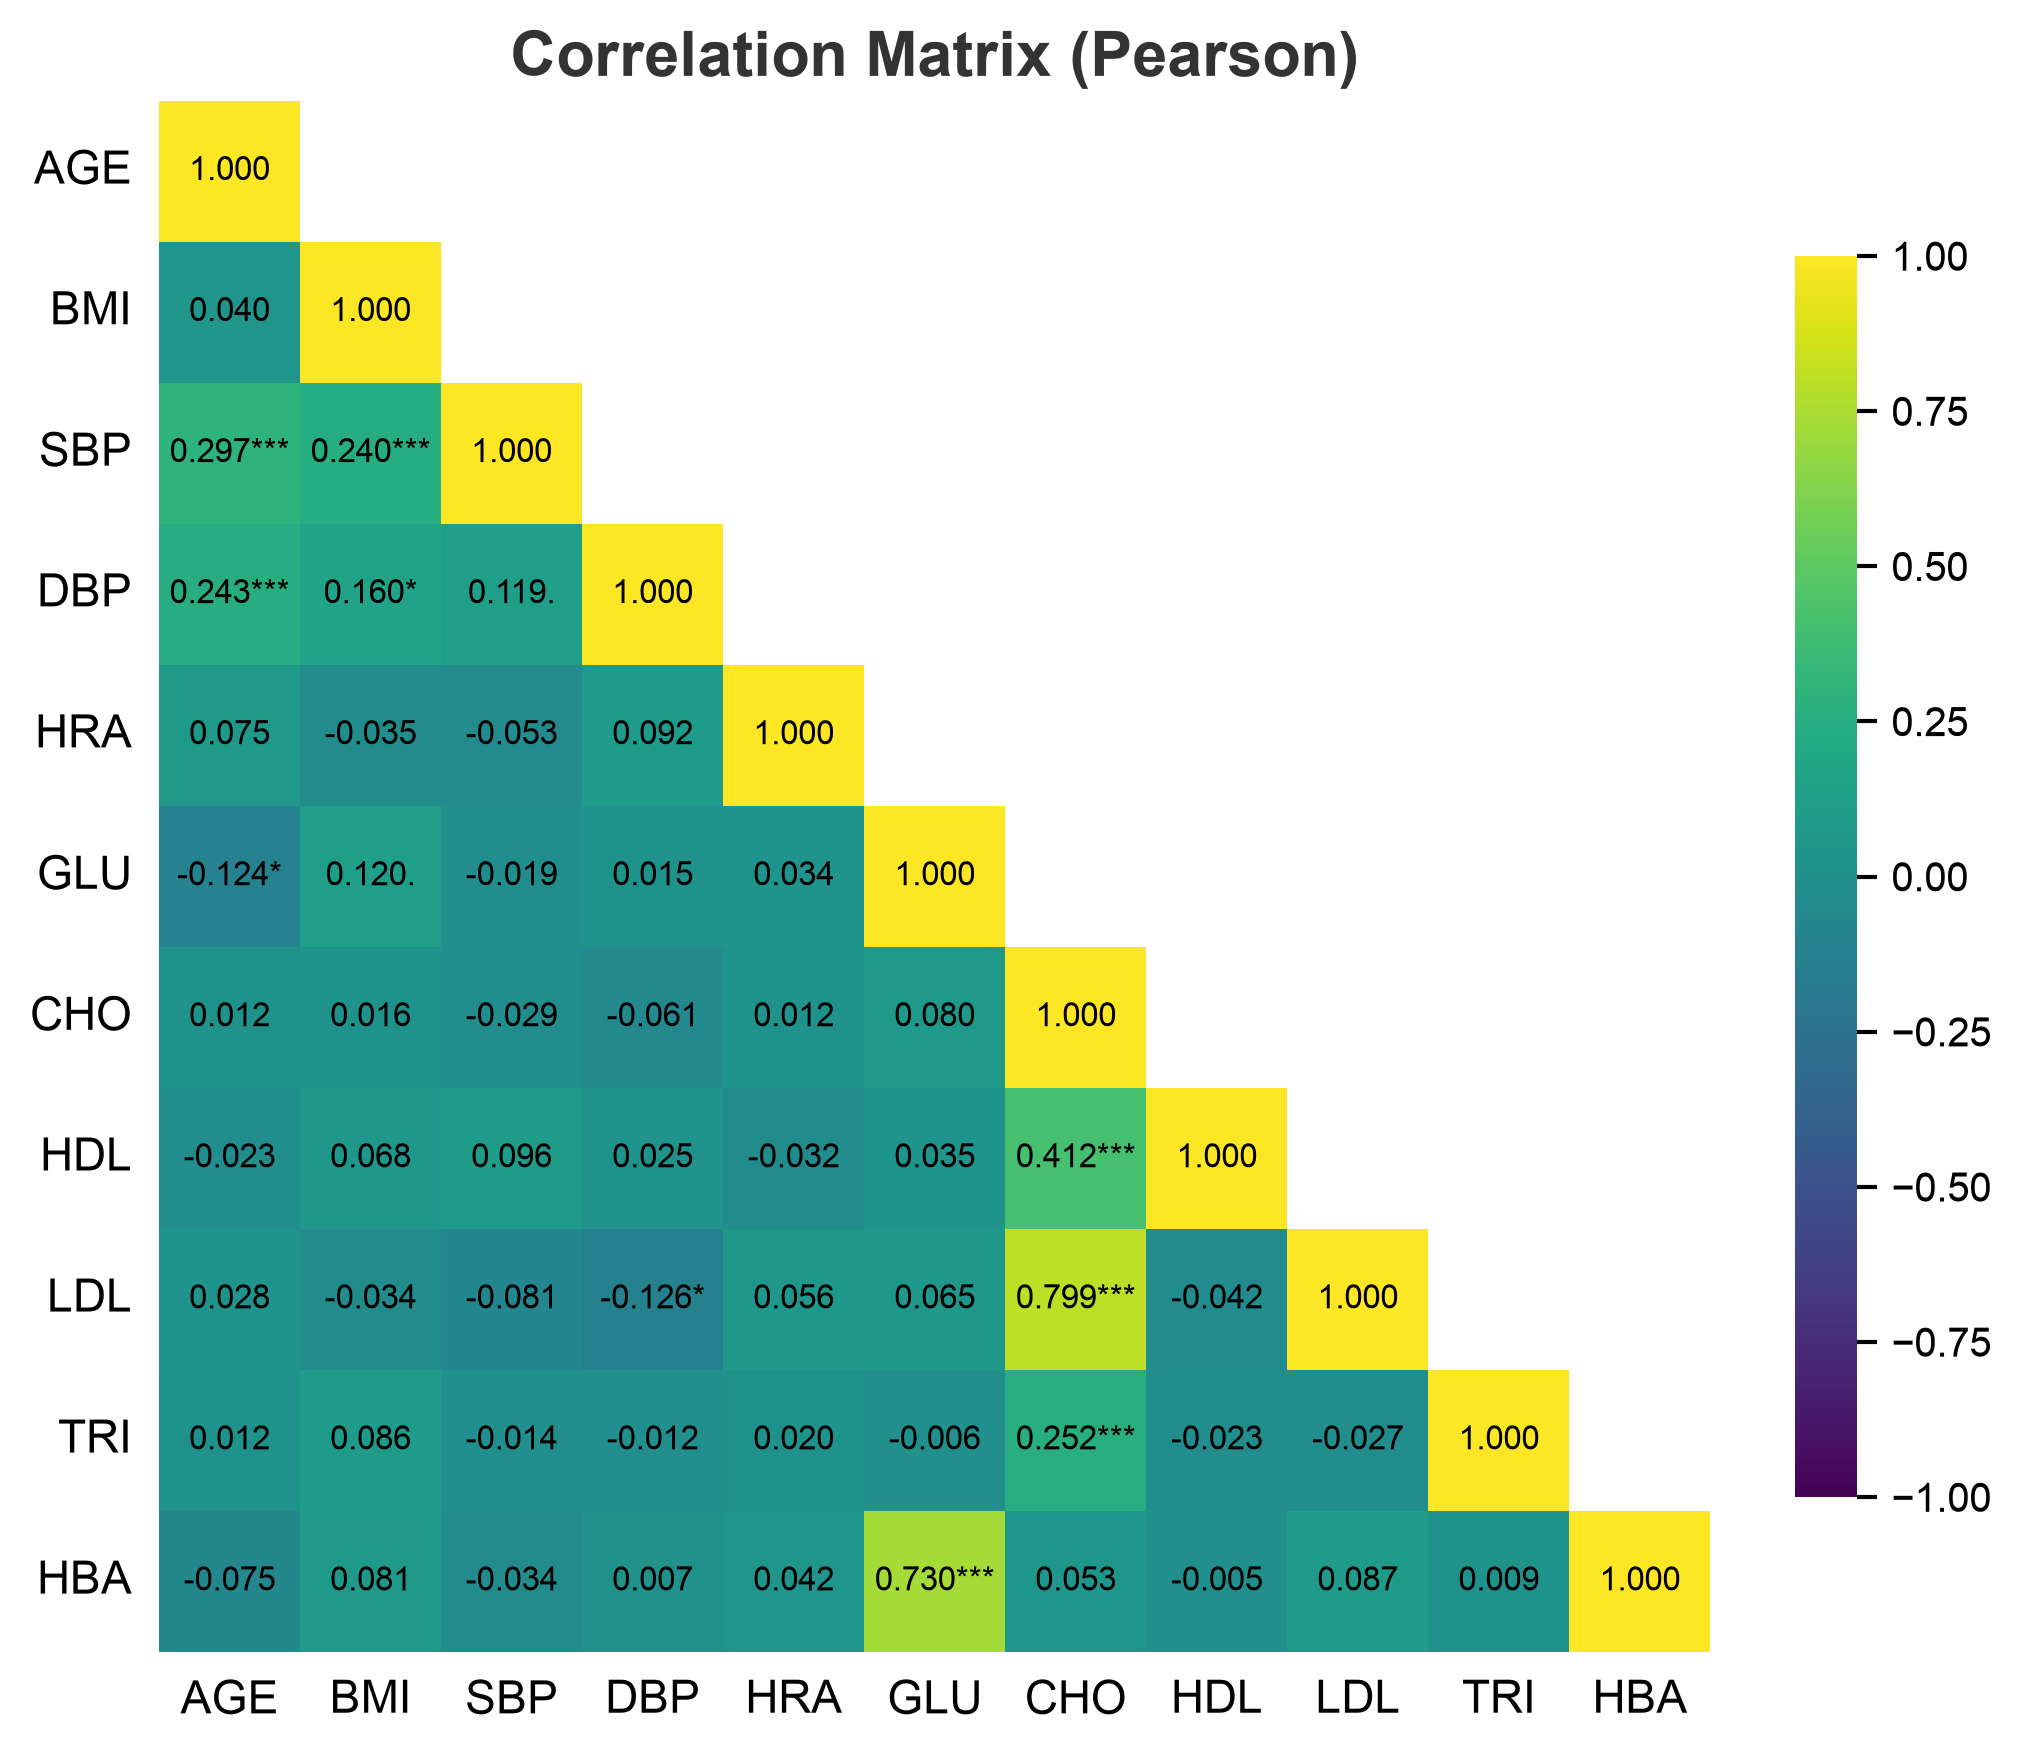
link Correlationr(498) = 0.978, 95% CI [0.973, 0.982], p < 0.001
trend Regressionβ = 6.78, SE = 0.13, p < 0.001, R² = 0.956
sparkles "Groups sharing a letter are not significantly different — the report adds the letters automatically."
Data quality

Detect outliers fast.

Find suspicious values using standard methods — then remove them automatically, from one variable or the whole sample.

IQRZ-scoreModified Z (MAD)Grubbs' test

Flagged values are highlighted in the data grid and box plot — inspect, then exclude with one click.

Color palettes

Color palettes designed for scientists.

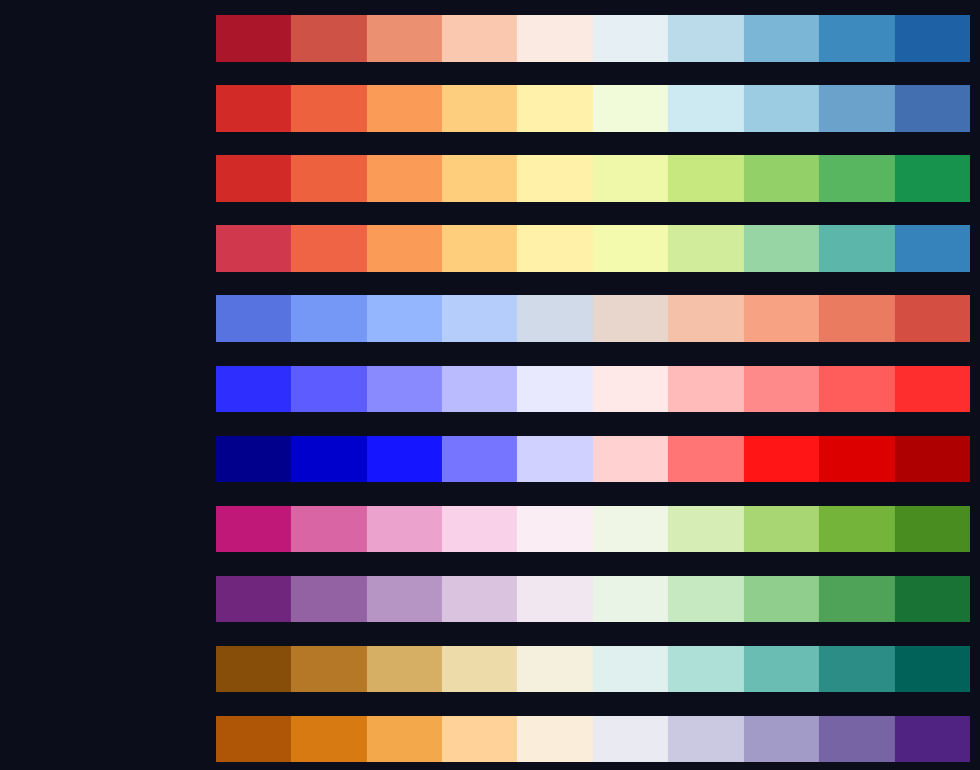
Choose from a curated catalog of perceptually uniform and colorblind-safe palettes — so your figures stay beautiful and publication-ready, not washed out or clashing.

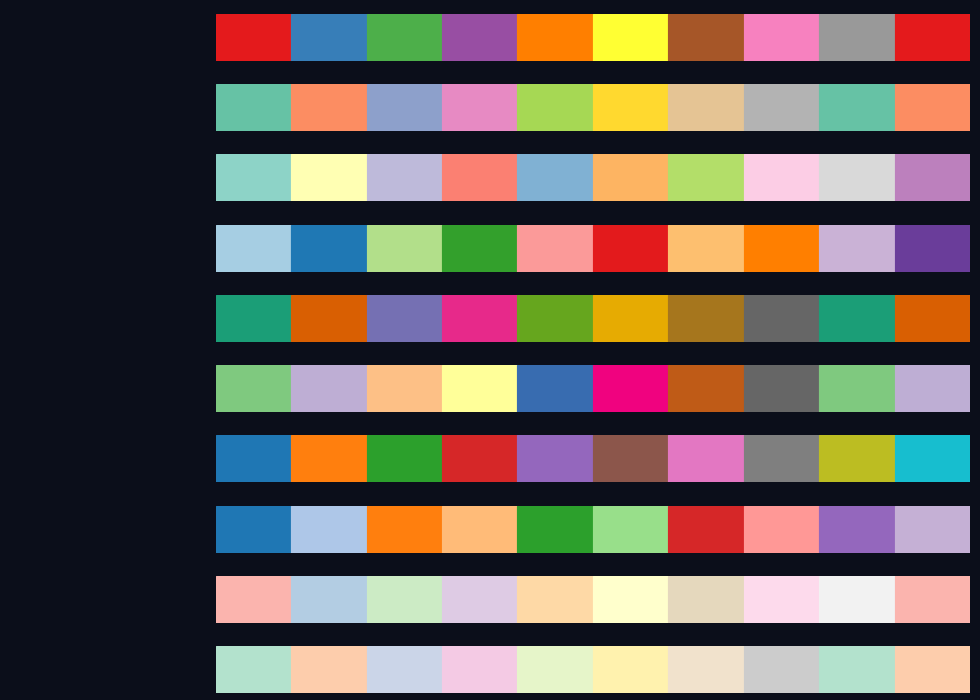
Qualitative

Perfect for categories and groups — distinct, harmonious colors that pop.

Qualitative palettes

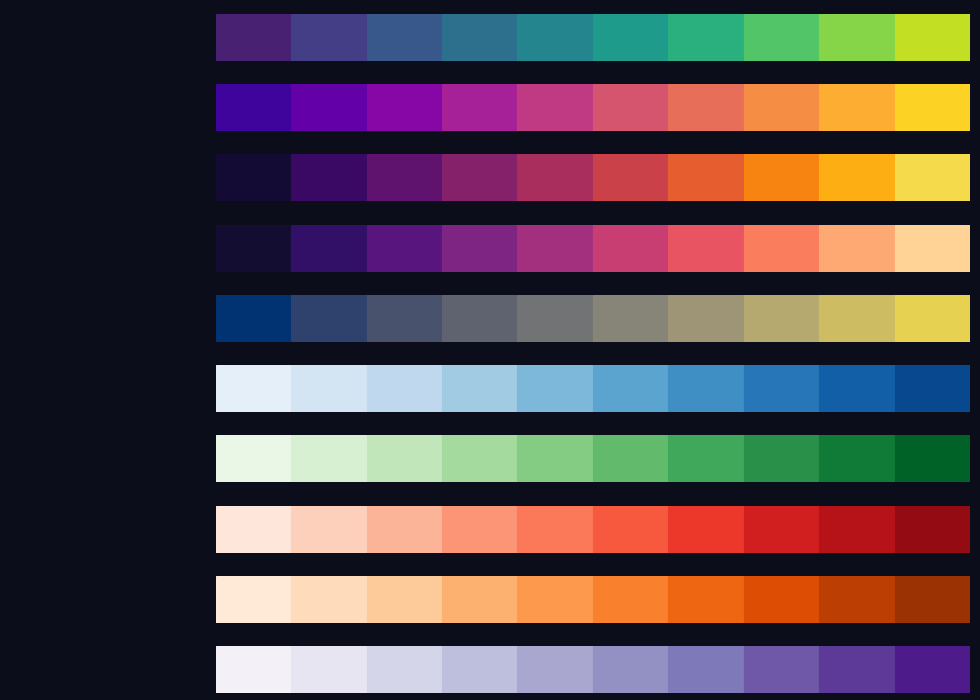
Sequential

Great for continuous data and gradients, perceptually uniform by design.

Sequential palettes

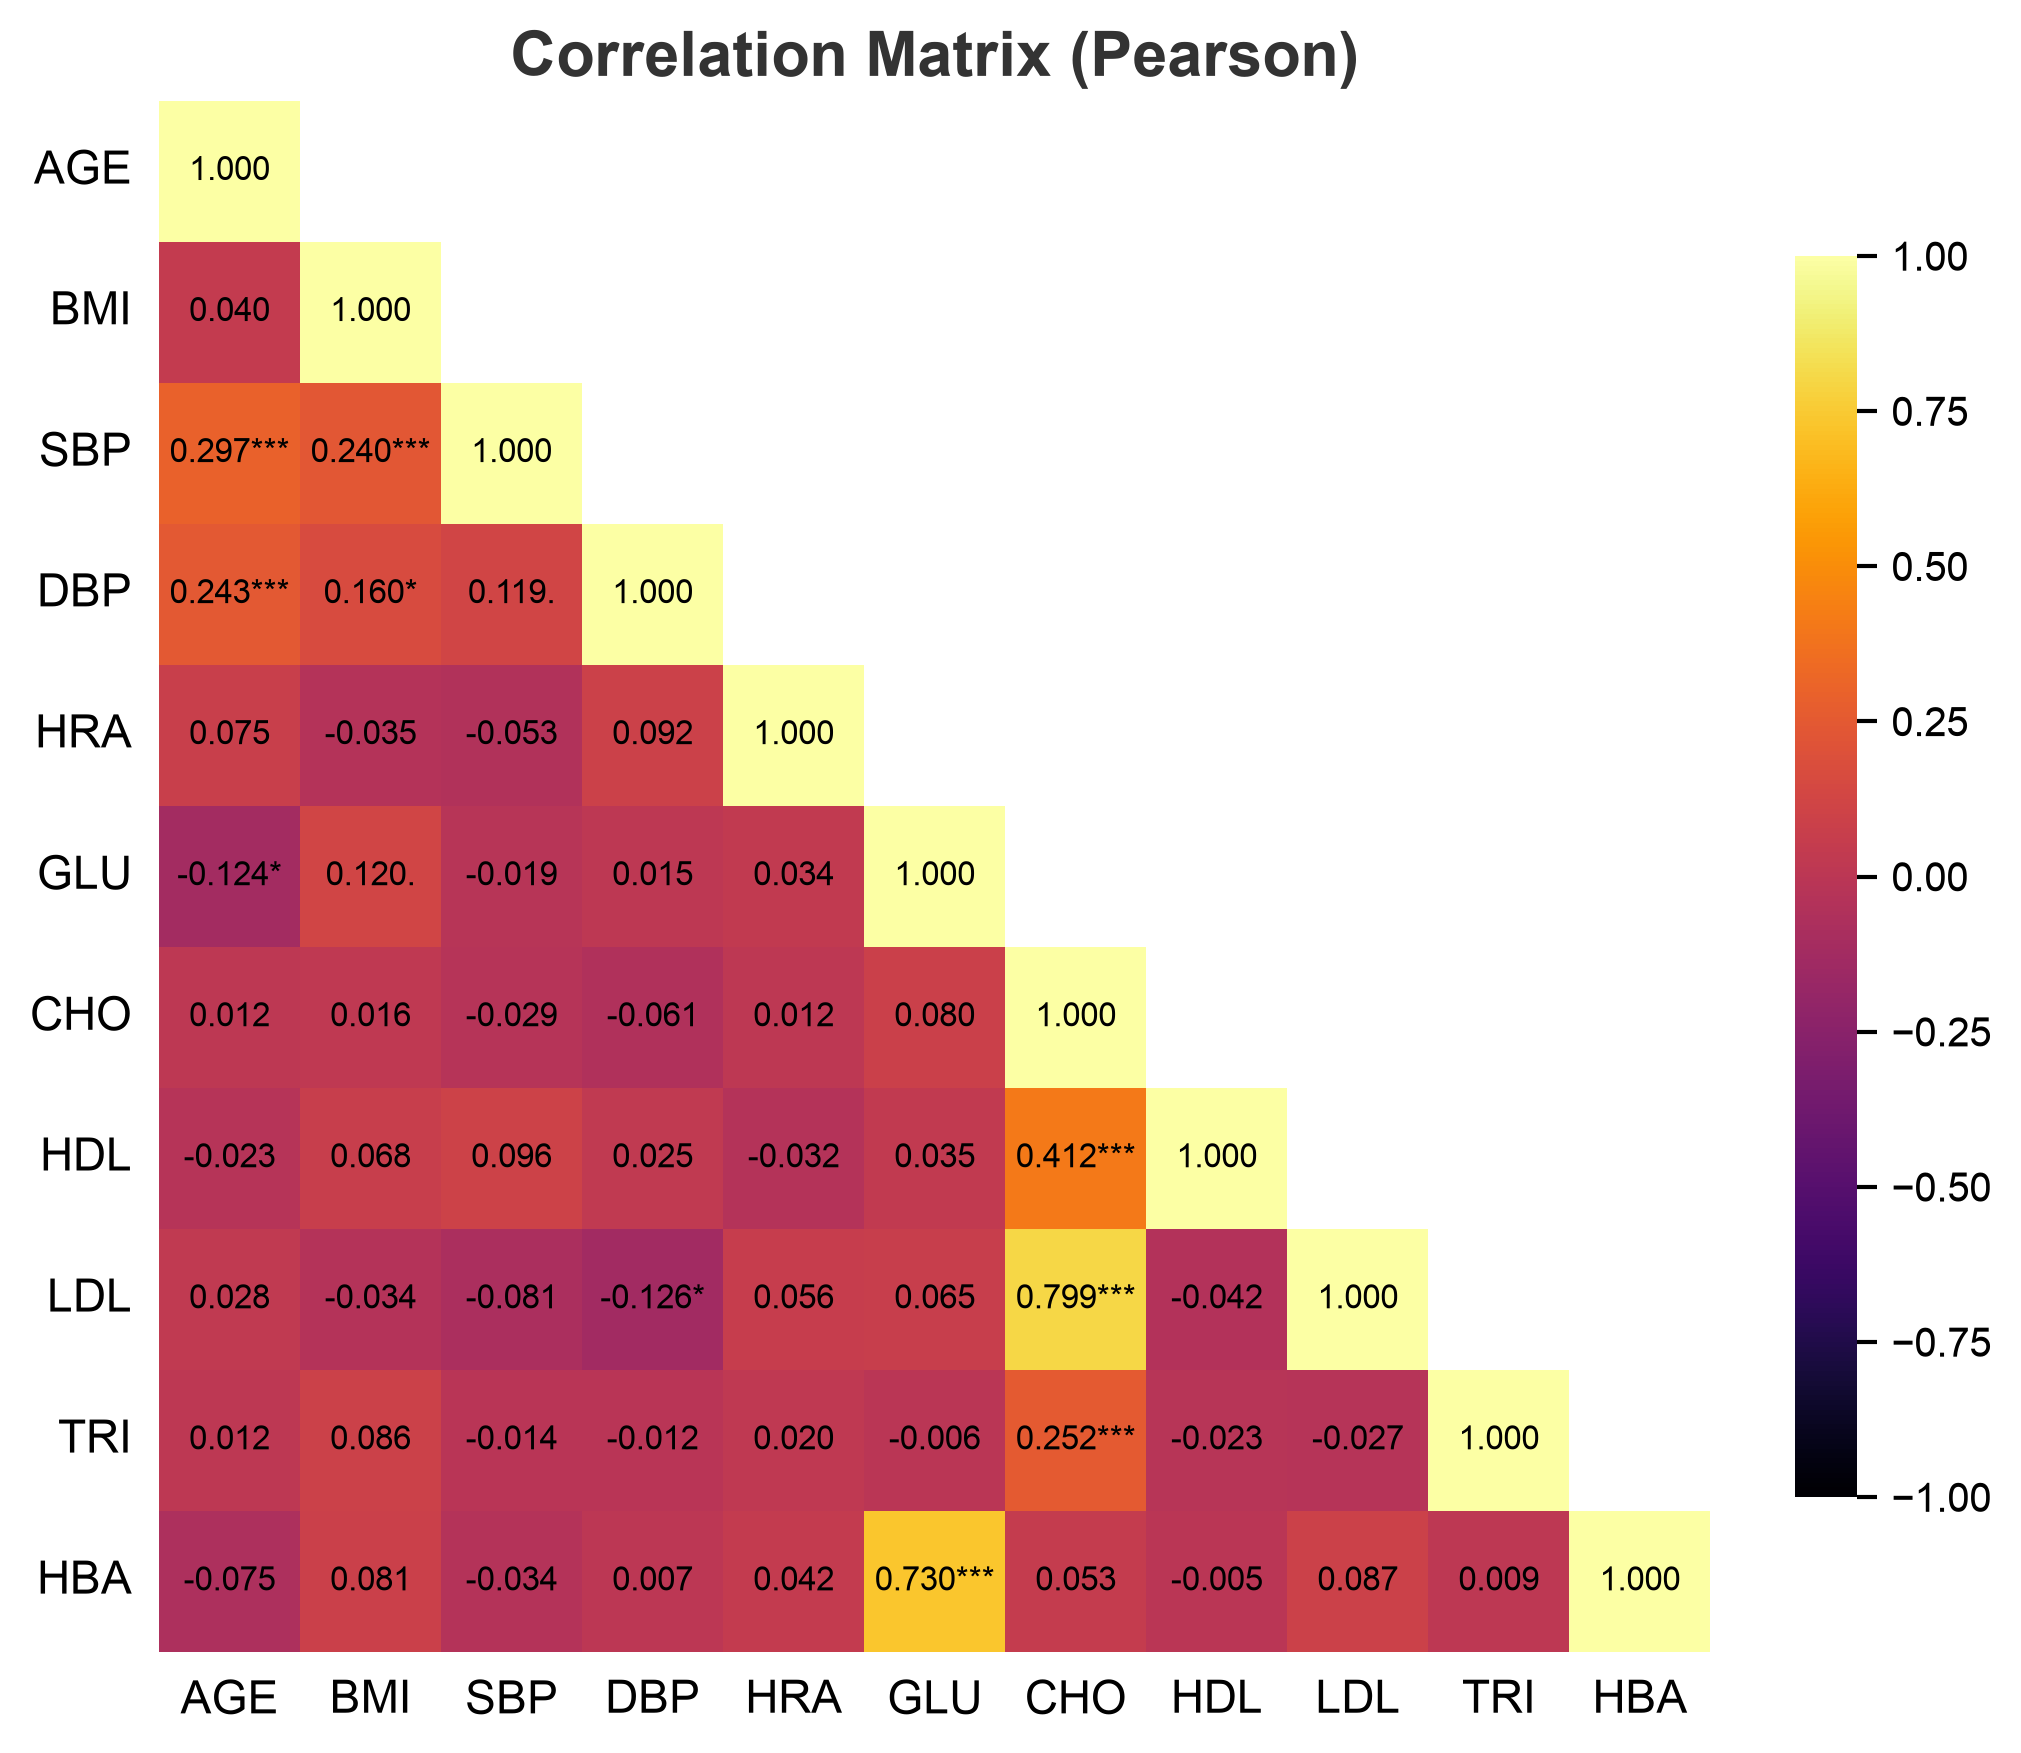
Diverging

Ideal for correlations and centered data — highlights direction and magnitude.

Diverging palettes

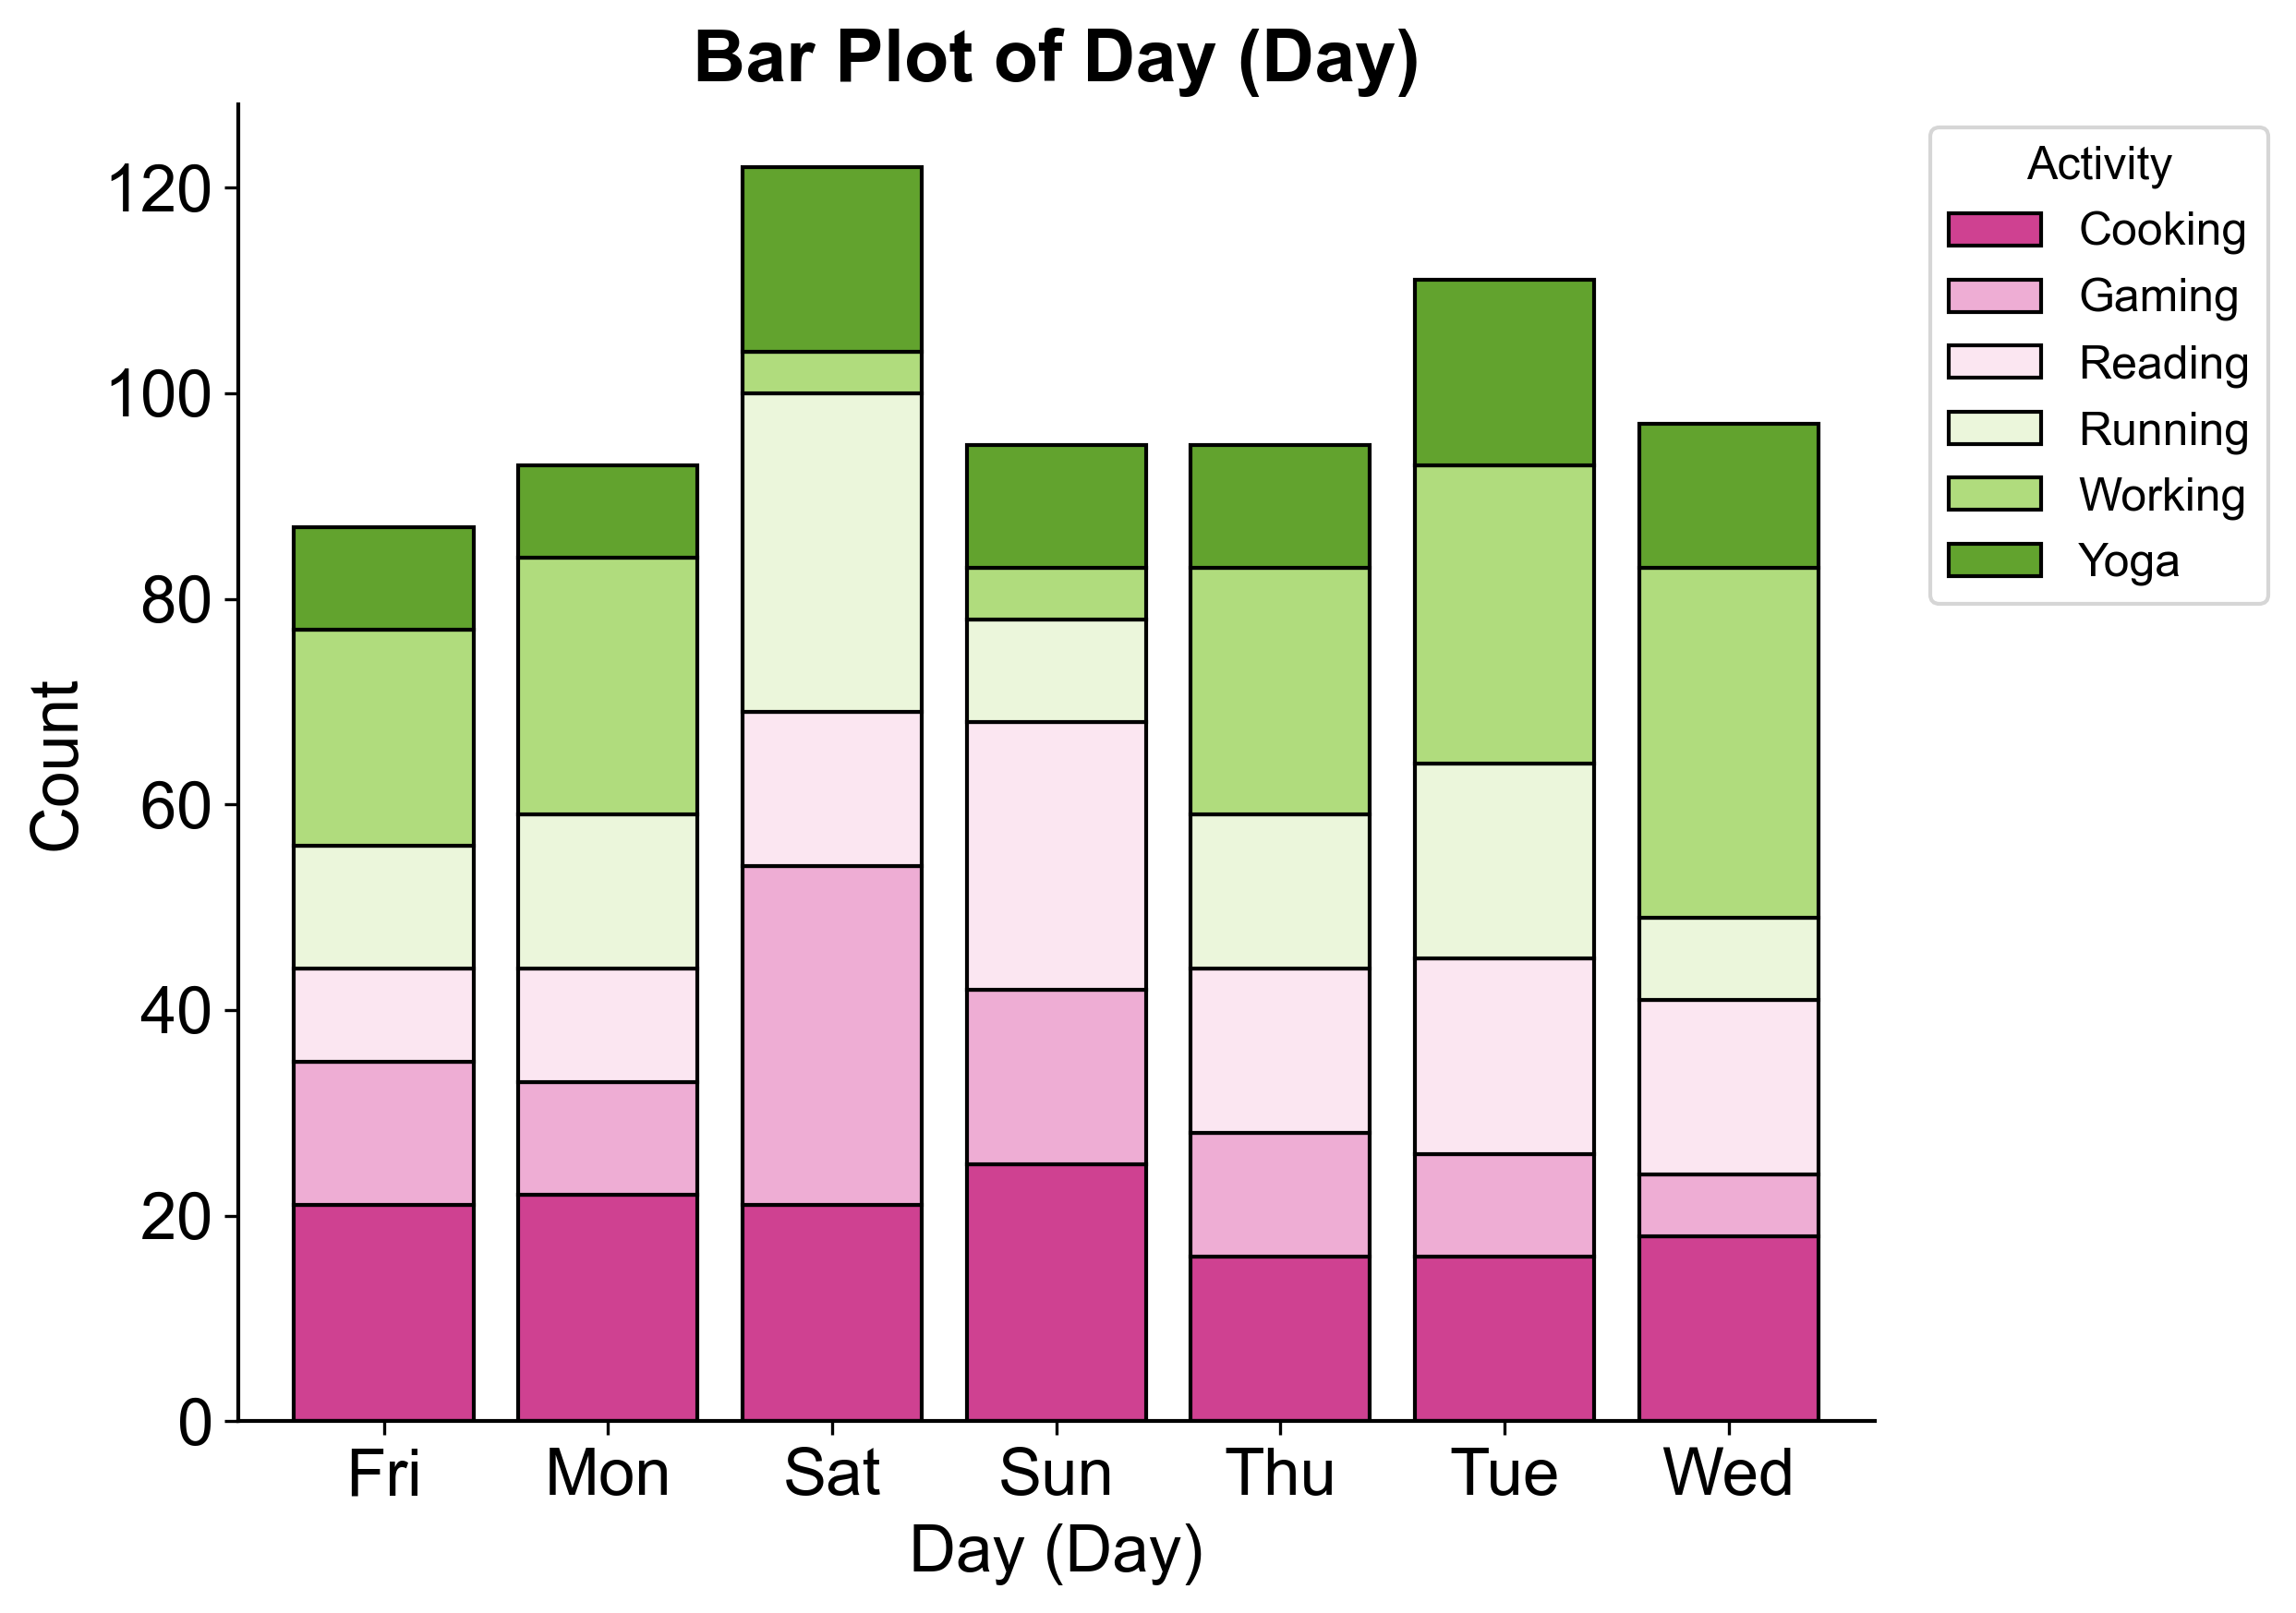
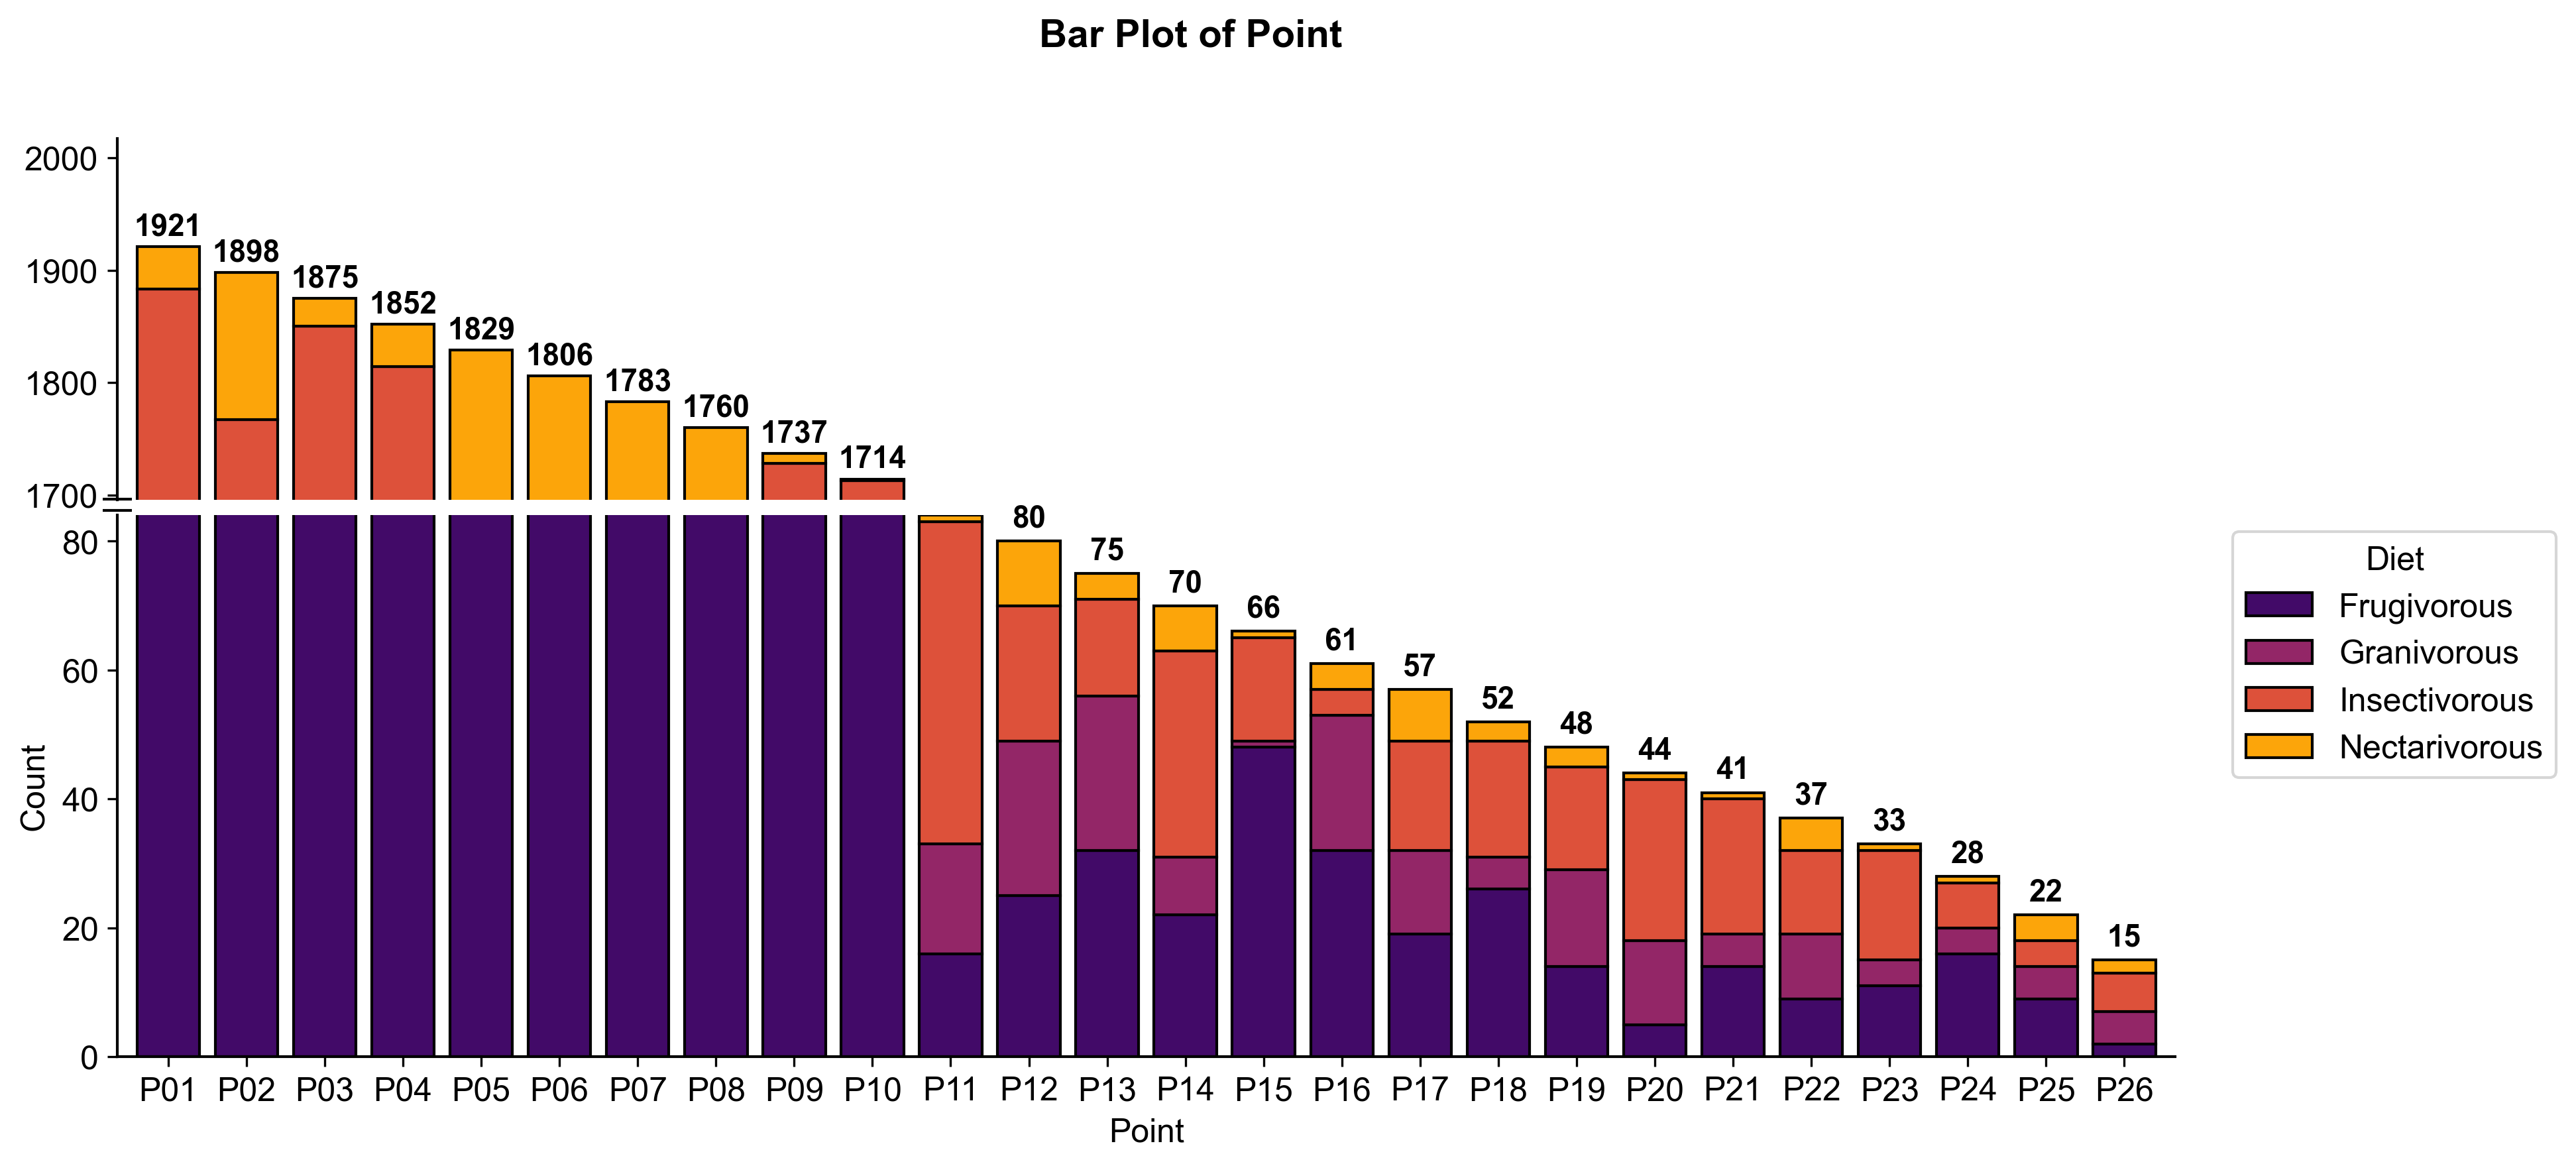
One palette selector across every figure — box plots, dot plots, scatter, bars, error plots, and more — with live color previews.

Questions

Frequently asked questions

No. Magic Stat is a window-based application, with menus and an integrated spreadsheet. You open the file, click the analysis and get a figure + table + formatted report.

Yes. Magic Stat runs on both Intel and Apple Silicon Macs. On Apple Silicon, macOS may ask to install Rosetta the first time you open the app — it's a one-click Apple feature that runs Intel apps smoothly, and you only do it once.

Yes — Windows 10/11, 64-bit, with the same full feature set as the macOS and Linux builds.

Yes. Magic Stat runs on Windows 10/11 and on 64-bit Linux, shipped as a self-contained AppImage — download it, mark it executable and run: no installation and no dependencies to chase. All three platforms (macOS, Windows and Linux) carry the same full feature set.

Yes. You get a 7-day free trial with full access to every feature — no credit card required. After the trial, activate the app with a license purchased on Gumroad.

The AI uses your own key (BYOK) with OpenAI, Claude or DeepSeek. The app itself works offline; the assistant needs a connection.

Excel (.xlsx/.xls), CSV and ODS (LibreOffice). You can also paste data straight into the spreadsheet.

Yes. Tables are born in scientific/APA format, and the report can be exported formatted — no copying raw output.

Pricing

One license, annual access.

US$ 990 per year. No subscriptions, no surprises.

gift 7-day free trial — full access to every feature, totally free, no card required.

calendar Annual license

Annual License

Every feature of Magic Stat on macOS, Windows and Linux — for one full year.

$ 990 USD / year

One payment per year · no hidden fees

  • Full access to every analysis & feature on macOS, Windows & Linux
  • AI assistant included (bring your own key)
  • APA-ready figures, tables & reports
  • All updates included with your subscription
  • Activation on 2 devices
Buy now — activate for 1 year
lock Secure checkout by Gumroad instant Instant delivery